
I wanted to follow-up and highlight an interesting point in the recent price rally in Google (GOOG: 554.59 +9.27 +1.70%) - specifically with regard to the price bounce off the key 'last-support' level I previously mentioned.
It's an interesting lesson that's worth repeating - here's the chart:
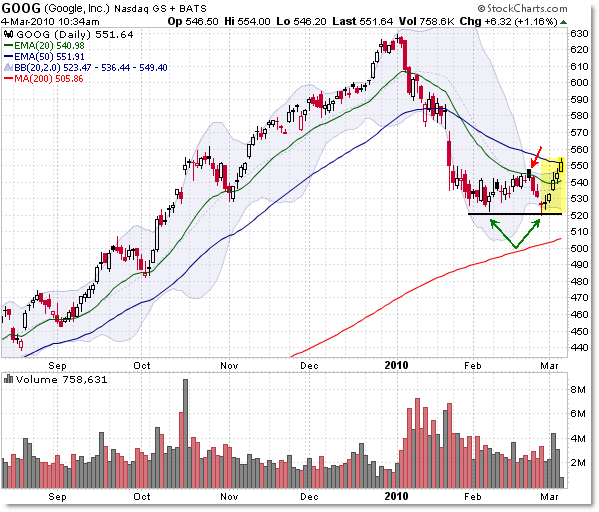
I had mentioned previously that the $520 level was the confirmation point in the otherwise ominous signs, including a bear flag short-sell entry (red arrow at $545).
Aggressive (risk-seeking) traders would go ahead and short at the 20 EMA to play for a new low yet to come, while conservative (risk-avoidant) traders would need to see a confirmed break under $520, shattering prior price support, as their entry point short.
I think this shows a great example of how important it is to monitor open positions and also - for some traders - to wait for confirmation before putting on a position.
The $520 level formed a simple boundary between expecting a potential support bounce (it happened) or confirming that odds favored downside action and targets.
As was the case here, Google formed two doji candles at the $520 level - the critical line in the sand - and rallied the last four trading sessions as aggressive bears covered positions in a mini-short squeeze rally this week (on higher volume!).
This serves as a testament that highlights the importance of simple technical levels - such as prior price support zones - as being key to interpreting the potential of the next swing in price.
It's back to the Mark Douglas style of thinking - "Find a price/line that price either has to break through or bounce off of, creating opportunity depending on what happens at that level."
If you were short from the $545 level, the two doji candles and the price break above the second doji on February 26th was a sign to take profits and perhaps stand aside to see how far a bounce could go.
A break under $520 would have been a trigger both to exit any long/buy positions (playing specifically for a bounce) or to put on new short-sale positions.
That's exactly why we seek to find "Lines in the Sand" on our charts - they're important levels that distinguish between bull and bear; buy and sell.
Google here reminds us that you don't have to use complex charting skills to find these areas - simple prior price support or resistance levels work just fine.


0 comments:
Post a Comment