imgadp

Top-Hot-Stocks

Hot Article ------ Favorites this page

2010-02-20

Market Week In Review

Markets rebounded strongly this week. In the process, most of the major market equity averages, commodity indices, and bond ETFs recouped January’s declines and are now back close to their December 31, 2009 levels. What happened?

Welcome to our Sense on Cents Week in Review where I provide a streamlined recap of the major economic data and news, along with month-to-date market returns.

ECONOMIC DATA

A lot of news and data this week. Some good. Some not so good. Let’s dive right in.

1. Industrial and manufacturing data were definite positives.  The New York State Manufacturing Index rose to 24.91 versus an expected reading of 18 and a prior month’s reading of 15.

Industrial production increased by .9 versus an expected reading of .8. Last month’s reading was revised higher from .6 to .7.

The Philadelphia Fed Manufacturing Survey increased to 17.6 from a consensus expectation of 17.0 and a prior month’s reading of 15.2.

2. Housing starts were mixed with groundbreaking for new homes increasing while permits declined. With mortgage delinquencies continuing to increase, this sector continues to face an uphill climb. Obama is committing another $1.5 billion in federal funding for the hardest hit markets.

3. Jobless claims very disappointingly ratcheted right back up by 43k to 473k. When will companies start to rehire? THIS STATISTIC REMAINS the GREATEST NEED and the GREATEST CHALLENGE!!

4. Leading Economic Indicators disappointed by registering a .3 reading from last month’s .5 level.

5. Inflation news is also a mixed bag. Increasing fuel and energy costs drove the Producer Price Index higher by 1.4%. The Consumer Price Index, up .2, also felt the higher energy costs but benefited from lower costs for shelter. That is a plus if you are a renter, but not if you are a landlord or homeowner.

The following market statistics are the weekly close (February 19th) versus January’s close and the subsequent month-to-date returns:

U.S. DOLLAR

$/Yen: 91.52 vs 90.19, +1.5%
Euro/Dollar: 1.361 vs 1.386, -1.8%
U.S. Dollar Index:
80.55 vs 79.48, +1.3%

Commentary: the overall U.S. Dollar Index continued to firm on the week, supported by the surprising rise in the discount rate by the Fed. The surprise was not in the actual move by the Fed, but by the timing inter-meeting. The Euro is near 9-month lows to the dollar on the back of the continuing fiscal drama, if not disaster, being played out in Greece. The dollar remains the safe haven . . . for now.

COMMODITIES

Oil: $80.07/barrel vs $72.64, +10.02% !!
Gold: $1119/oz. vs $1081.7, +3.4%
Copper:
$3.36 vs $3.10, +8.4%
DJ-UBS Commodity Index:
134.84 vs 129.05, +4.5%

Commentary: commodities rebounded strongly on the week. The overall DJ-UBS Commodity Index was up 4.5%, led by copper which rallied close to 7% and is now back to unchanged on the year. What drove the action in this sector? Indications of a pickup in the industrial sectors both here at home and abroad. In speaking with a friend involved in the shipping business, he confirmed that activity has definitely picked up. The risks remain whether activity can be sustained in the face of tighter monetary policies (that is, rising rates) here and abroad.

EQUITIES

DJIA: 10,402 vs 10,067, +3.3%
Nasdaq: 2244 vs 2147,+4.5%
S&P 500: 1109 vs 1074, +3.3%
MSCI Emerging Mkt Index:
943 vs 940, +.3%
DJ Global ex U.S.:
191 vs 191.9, -.5%

Commentary: a solid week for our domestic equity markets have now brought these averages back very close to unchanged on the year. Emerging and international markets remain down approximately 4-5% for the year given concerns both in the Euro-zone and prospects for higher rates in Asia. Overall performance for the month remains impressive given those overseas developments. What is supporting the equity markets? Overall positive earnings reports. Can these earnings be sustained? Will they lead to job growth? Will economic traction gain a foothold before being limited by the inevitability of higher rates?

BONDS/INTEREST RATES

2yr Treasury: .92% vs .82%, +10 basis points or -.10% (rates up, bond prices down)
10yr Treasury: 3.78% vs 3.59%, +19 basis points or +.19%

COY (High Yield): 6.84 vs 6.81 +.4%
FMY (Mortgage): 18.40 vs 18.62, -.4%
ITE (Government): 57.78 vs 57.83, -0.5%
NXR (Municipal):
14.22 vs 14.33, -1.3%

Commentary: interest rates moved higher this week. Why? A rebound in the equity and commodity markets given positive industrial news and earnings news. The Fed has repeated it will continue to hold its Fed Funds target at 0-.25% for an extended period, but after the surprise inter-meeting move by the Fed to raise its discount rate, some market participants now believe the Fed will raise the Fed Funds rate sooner rather than later. There are some pressures within the municipal space given increased refinancing risks of many municipalities in the face of severe budgetary pressures and declining tax revenues.

SUMMARY/CONCLUSION

The rollercoaster continues. The January declines - both in the markets and along our economic landscape - have been met by a nice upswing in February. What are we to make of it? Well, I hope you are strapped in for a long ride filled with ongoing fits and starts, twists and turns, ups and downs on both Wall Street and more importantly Main Street.

I will do my best to point out both the pitfalls and potential positives along the way. Please help our collective effort by sharing news and developments from your own corners of the world. Together, we can all most effectively navigate the economic landscape.

Gold & Silver: Bullish In The Short-Term, Bearish In The Long Run?

Investing your money in a long-term position can be likened to navigating a ship to port. The compass (fundamental and technical analysis) points you in the right direction as you head out to sea. Even if your ship is sturdy (you have made the right call and are heading in the right direction) every once in a while a big, unexpected wave seems to push you off course.

And without question, since the beginning of the economic crisis, the seas have become especially turbulent.

One such wave was the announcement this Wednesday by the IMF that it would begin phased open-market sales of the remaining 191.3 tons of gold it plans to sell under a program launched last year to raise money for lending. The price of gold dropped 1 percent on the news.

To remind you, this comes nearly four months after India purchased 200 tons from the IMF, news that helped push the price of gold up. So what is the difference?

The IMF had announced last year that it would sell 403.3 tons of gold, about one-eighth of its total stock. Until now, the gold has been made available only to central banks on a first-come-first-serve basis. So far, India — the world’s biggest consumer of gold — Mauritius and Sri Lanka have purchased a total of 212 tons of IMF gold. The average price for the three sales was a little over $1,050 an ounce, generating about $7.2 billion in proceeds.

In a carefully worded press release, the IMF said that “in accordance with the priority of avoiding disruption of the gold market, the on-market sales will be conducted in a phased manner over time.”

The press release further noted that this does not preclude off-market sales directly to interested central banks.

It is well known that China is interested in increasing its gold reserves. China is sitting on top of a huge mountain of dollar reserves. In fact, a day before the IMF announcement, the US Treasury Department released data showing that Japan overtook China to become the world’s biggest foreign holder of U.S. Treasury debt, reclaiming the title for the first time in more than a year. China shed more than $34 billion in long-and-short-term Treasury debt in December, while Japan added $11.5 billion, according to the monthly Treasury International Capital report.

So, it wouldn’t surprise anyone if China steps in and buys some of the IMF gold. Perhaps, as was mentioned in last week’s Premium Update, China is waiting for a better price.

We believe that the IMF announcement will have a negligible effect on the long-term price of gold. The IMF said it would stagger the sales. But even if it were to dump all the tons at once, it seems that they would be almost immediately absorbed by China, Russia, Middle Eastern sovereign funds and other central banks.

In this case, it seems that we don’t need a confirmation that gold is still a very-long-term buy in the form of the news that George Soros charged into gold during the fourth quarter even despite the fact that gold prices had already run up substantially. He doubled the stake of his fund in the world’s largest gold ETF, becoming the fourth- largest holder in the SPDR Gold Trust. As of December 31, gold is Soros’s largest single investment.

Moving back to the analogy from the beginning of this update - we have set our course and we will keep a close eye on the charts to get us safely to port. This week, we prepared two charts for you - one featuring gold, and the second one with one of our unique indicators. Let’s begin with the gold market (charts courtesy of http://stockcharts.com.)

Gold - Long-term Chart

In the previous essay we wrote the following:

(…) we see that the similarity that was present during the latest decline is still present after gold bottomed. This time, however, it suggests that gold may soon need to consolidate for a week or so - just like it took place in the past. Please take a look at the areas marked with red rectangles - gold paused when it moved to the declining short-term resistance line (April 2009), or it broke above it and then verified it as support (October 2008, July 2009). Should history repeat once again, we can see a similar pattern also this time (…)

These comments are up-to-date also this week, only this time we already know that gold moved above the declining resistance line, just like it did in July 2009 and September 2008. This means that gold may need to form a temporary top here, which would take gold lower, most likely to the $105 - $107 area in the GLD ETF.

Is gold likely to have topped right now? Not necessarily, based on the situation in the RSI indicator. In the past this particular indicator needed to move to the level marked with the dashed red line before the temporary top was in. Currently, the RSI indicator is visibly below it, so we may see additional several days of higher prices before gold declines significantly.

The Stochastic indicator is above the 80 level, just like it was the case in the past during local tops, but it has also stayed there for some time before the top has been put, so it is a necessary factor, but not sufficient one. In other words, if Stochastic wasn’t above 80 level, we would be reluctant to say that we may see a temporary top soon, but since it is above 80 it doesn’t mean that the top is in.

Given the historical performance of the yellow metal, we might expect the consecutive decline to be rather small (the preceding downswing is not even close to being as dramatic as the 2008 one), so it seems that it is not much of an opportunity for shorting the precious metals market, unless we see a confirmation that general stock market’s decline can cause PMs to plunge.

The last chart that we would like to feature this week is the one featuring one of our own indicators - the SP Gold Bottom Indicator.

Gold Bottom Indicator

According to its name, the above indicator provides buy signals for gold. The buy signal is given, when indicator breaks down lower dashed line, or when it breaks up through the upper dashed line. Since it has just moved above the lower line, it means that it will move below it sooner or later, most likely during the coming small correction, thus generating a buy signal.

Summing up, the precious metals market has moved higher, and it appears that it will need to take a small breather relatively soon. Gold, silver, and PM stocks are currently following the general stock market more closely than the follow the USD Index. This is a positive factor in the very-short-term (main stock indices are rising), but negative in the long run because the situation on the general stock market is still bearish from the long-term point of view.

Meanwhile, one of our unique indicators is about to flash a buy signal. This is positive news for the whole precious metals market, not only for gold itself, but we still need to monitor the situation on the general stock market and check how gold corresponds. Several days of divergence between PMs and the main stock indices will most likely be enough to let us know that PMs are ready to rise once again. For now, we must remain cautious.

Until It’s Too Late

Throughout the financial crisis, policymakers have focused on keeping things afloat until the storm passes. They've spent vast sums of taxpayer funds trying to jumpstart growth until the economy is back on track. They've encouraged people to keep the faith until businesses start hiring again.

But what happens if all those "untils" turn out to be wide of the mark? What if the carnage we've experienced so far is structural, not cyclical? If that's the case, then Americans are going to find that instead of experiencing better times ahead, they are going to be much worse off than they were ― or are.

Why? Because they've not been adjusting lifestyles and spending habits to take account of a step-change decline in living standards. And, they've not been reorienting the way they manage household finances and investments to take account of a much riskier economic and financial outlook.

In addition, many people have not been focusing strongly enough on acquiring new skills and seeking alternative careers that take account of big changes in the job market. As the following collection of articles suggests, not only is the overall employment situation likely to remain problematic for years to come, prior work experience may no longer be relevant.

"Getting Back Lost Jobs Could Take 5-Plus Years" (Associated Press)

Even with political focus on jobs, return to prerecession work levels could take 5-plus years

Job creation is stuck on an uphill treadmill.

So many jobs have been lost that the U.S. must run hard just to keep from losing more ground. Despite the election-year emphasis on job creation by both parties, the short-term outlook is bleak.

While many economists believe the recession is technically over, nearly 15 million Americans remain unemployed. Six million of them have been out of work for more than half a year.

President Barack Obama is asking for almost $300 billion more for recession relief and job formation. The House last December passed a $154 billion spending bill focused on jobs. The Senate is due to debate a far more modest version on Monday, but appears bogged down in partisan bickering.

With or without new legislation, reducing a jobless rate that's now just under 10 percent to prerecessionary rates of about half that won't happen soon, especially as government efforts to prop up the economy begin to wind down.

It could take up to five years or more just to get back to even.

There are limits to how many jobs can be created by government action ― either directly or with tax and other incentives for the private sector ― and how quickly.

"We've gone though a period of enormous job loss," said Robert Shapiro, a former adviser to President Bill Clinton and now chairman of Sonecon, an economic advisory firm.

"The long-term problem is exacerbated by the fact that credit's still not available because we really haven't reformed the financial system. People don't have confidence in the future and people are poorer so demand is down. All these things are coming together," Shapiro said.

Returning to prerecession employment levels and keeping up with working-age population growth will require the creation of 10 million or more jobs.

"Despite Signs of Recovery, Chronic Joblessness Rises" (New York Times)

BUENA PARK, Calif. ― Even as the American economy shows tentative signs of a rebound, the human toll of the recession continues to mount, with millions of Americans remaining out of work, out of savings and nearing the end of their unemployment benefits.

Economists fear that the nascent recovery will leave more people behind than in past recessions, failing to create jobs in sufficient numbers to absorb the record-setting ranks of the long-term unemployed.

Call them the new poor: people long accustomed to the comforts of middle-class life who are now relying on public assistance for the first time in their lives ― potentially for years to come.

Yet the social safety net is already showing severe strains. Roughly 2.7 million jobless people will lose their unemployment check before the end of April unless Congress approves the Obama administration's proposal to extend the payments, according to the Labor Department.

Here in Southern California, Jean Eisen has been without work since she lost her job selling beauty salon equipment more than two years ago. In the several months she has endured with neither a paycheck nor an unemployment check, she has relied on local food banks for her groceries.

She has learned to live without the prescription medications she is supposed to take for high blood pressure and cholesterol. She has become effusively religious ― an unexpected turn for this onetime standup comic with X-rated material ― finding in Christianity her only form of health insurance.

"I pray for healing," says Ms. Eisen, 57. "When you've got nothing, you've got to go with what you know."

Warm, outgoing and prone to the positive, Ms. Eisen has worked much of her life. Now, she is one of 6.3 million Americans who have been unemployed for six months or longer, the largest number since the government began keeping track in 1948. That is more than double the toll in the next-worst period, in the early 1980s.

"Recovery or Not, Some Charlotte-Area Jobs Are Gone Forever" (Charlotte Observer)

Experts say new economy can no longer support some jobs created during the boom, including finance.

Despite some hopeful signs, the Charlotte area's economy won't outpace unemployment anytime soon, economists warn.

Some jobs are gone forever, and those that will replace them could leave the region's lowest-skilled and least-educated workers struggling to catch up, experts say.

"The question is, are growth levels adequate enough to get us out of the hole we're in? It doesn't look like it," said John Quinterno of South by North Strategies Ltd., a Chapel Hill economic research firm.

Some jobs are cyclical, and economists expect them to bounce back once demand and consumer spending increase. But they worry: Government stimulus spending, which has helped spur that demand, is not a permanent fix. What's more, a larger shift is under way, with the economy moving from production to services-based.

Economists say the new economy can no longer support some construction, real estate and finance jobs created during the boom. Many manufacturers, too, will continue to do more with less, replacing workers with technology and sending more jobs overseas.

"Fed See Slow Job Recovery into 2012″ (Journal Sentinel)

While the economy is getting better, the jobless rate is expected to remain high - possibly for years - because of financial uncertainty among households and businesses, Federal Reserve policy-makers said when they met in a closed-door session last month.

Minutes of the Fed meeting of Jan. 26-27, which were released Wednesday, show that officials think the unemployment rate this year will range between 9.5% and 9.7%, and from 8.2% to 8.5% in 2011. In 2012, the rate likely will be between 6.6% and 7.5%, the Fed panel forecast.

A "sizable minority" of the Fed policy-makers took the view that a return to more-normal growth and employment could take more than five to six years.

"The Long-Term Employment Bust" (First Things)

High levels of unemployment may last indefinitely. A number of economists (including this writer) have been warning about permanent joblessness, and the idea is now seeping into popular magazines.

More than 8 million American jobs were lost since 2007, based on the most recent revision of the overall job count of U.S. establishments. But that is not the worst of it, because the establishment survey fails to capture smaller businesses and the self-employed. By the Bureau of Labor Statistics' broadest measure of unemployment, including the forced part-time workers and so-called discouraged workers, the unemployment rate rose to 17 percent from 8 percent before the recession. That is 9 percentage points, corresponding to slightly over 12 million adults. A website called Shadow Government Statistics includes "long-term discouraged" workers defined out of the labor force by the BLS, but that alternative measure has tracked the BLS broad measure quite closely in the past few years.

There are several reasons to believe that most of these jobs never will come back. That is a less contentious statement than it might appear, because the jobs lost in the recessions since 1981 never came back. Some sectors, notably manufacturing, continued to shrink, and other sectors, such as heath care and retail, replaced them. The difference in 2010 is that it is not apparent where new jobs will come from.

"How a New Jobless Era Will Transform America" (The Atlantic)

The Great Recession may be over, but this era of high joblessness is probably just beginning. Before it ends, it will likely change the life course and character of a generation of young adults. It will leave an indelible imprint on many blue-collar men. It could cripple marriage as an institution in many communities. It may already be plunging many inner cities into a despair not seen for decades. Ultimately, it is likely to warp our politics, our culture, and the character of our society for years to come.

How should we characterize the economic period we have now entered? After nearly two brutal years, the Great Recession appears to be over, at least technically. Yet a return to normalcy seems far off. By some measures, each recession since the 1980s has retreated more slowly than the one before it. In one sense, we never fully recovered from the last one, in 2001: the share of the civilian population with a job never returned to its previous peak before this downturn began, and incomes were stagnant throughout the decade. Still, the weakness that lingered through much of the 2000s shouldn't be confused with the trauma of the past two years, a trauma that will remain heavy for quite some time.

The unemployment rate hit 10 percent in October, and there are good reasons to believe that by 2011, 2012, even 2014, it will have declined only a little. Late last year, the average duration of unemployment surpassed six months, the first time that has happened since 1948, when the Bureau of Labor Statistics began tracking that number. As of this writing, for every open job in the U.S., six people are actively looking for work.

All of these figures understate the magnitude of the jobs crisis. The broadest measure of unemployment and underemployment (which includes people who want to work but have stopped actively searching for a job, along with those who want full-time jobs but can find only part-time work) reached 17.4 percent in October, which appears to be the highest figure since the 1930s. And for large swaths of society―young adults, men, minorities―that figure was much higher (among teenagers, for instance, even the narrowest measure of unemployment stood at roughly 27 percent). One recent survey showed that 44 percent of families had experienced a job loss, a reduction in hours, or a pay cut in the past year.

There is unemployment, a brief and relatively routine transitional state that results from the rise and fall of companies in any economy, and there is unemployment―chronic, all-consuming. The former is a necessary lubricant in any engine of economic growth. The latter is a pestilence that slowly eats away at people, families, and, if it spreads widely enough, the fabric of society. Indeed, history suggests that it is perhaps society's most noxious ill.

The worst effects of pervasive joblessness―on family, politics, society―take time to incubate, and they show themselves only slowly. But ultimately, they leave deep marks that endure long after boom times have returned. Some of these marks are just now becoming visible, and even if the economy magically and fully recovers tomorrow, new ones will continue to appear. The longer our economic slump lasts, the deeper they'll be.

If it persists much longer, this era of high joblessness will likely change the life course and character of a generation of young adults―and quite possibly those of the children behind them as well. It will leave an indelible imprint on many blue-collar white men―and on white culture. It could change the nature of modern marriage, and also cripple marriage as an institution in many communities. It may already be plunging many inner cities into a kind of despair and dysfunction not seen for decades. Ultimately, it is likely to warp our politics, our culture, and the character of our society for years.

National Bank Of Greece Not An Achilles Heel

As the Greek philosopher extraordinaire Plato would have it, the realm of ideas is absolute reality, and truth itself is an abstraction. The Greek government(s) have been denying truth, reality and ideas for too long, and now they will be, in part, held to account. If the assumption that the EU will not let Greece fail is correct, there is an opportunity in Greek securities that may be appropriate for their speculative portfolio.

I have been following three Greek stocks that are traded as ADR’s. These are Coca-Cola Hellenic (CCH) which trades at $23.17 with a 1.70% yield and has a wide presence outside of Greece, Hellenic Telecom (OTE) which trades at $6.35 with a 8.17%yield and may be at some risk short term to the Greek meltdown, and the National Bank of Greece(NBG) which trades at $3.71 with no dividend.

None of the three common stocks listed above thrill me. CCH appears fully priced, OTE may not hold the dividend and also will suffer distress from a very weak Greek consumer, and the NBG common stock, while holding promise, does not pay you to wait for better times.

What to do? Investors may want to explore the National Bank of Greece $2.25 Preferred Shares (Euronext symbol NBGPRA, or look for the National Bank of Greece Preferred Class A security, NBGpA). This security is liquid, averaging about 160,000 shares traded over the latest 10-day period. Trading at $20.80 and yielding 10.82%, investors stand a good chance to be handsomely rewarded with a high yield and the possibility of a capital appreciation as the security has a $25.00 call feature which can be exercised in 2013. Note that the preferred goes “ex” on March 3rd with the dividend paid shortly thereafter. Dividend are in US dollars taxed at the low 15%rate.

A downside to this security is that the dividends are not cumulative. In case they are skipped,or dropped, you lose. I view this as unlikely now that Europe is propping up the monetary system. The National Bank of Greece, like J.P. Morgan in the US at the height of the banking crisis, may pay little or no common stock dividends but will likely continue to pay on the preferred.

As James Altucher, managing director at Formula Capital, stated on CNBC recently, “It’s the safest bank in Greece….they’ve got a solid balance sheet and trade at seven times earnings.”

If you are gaming Greece, it may be better to hopefully control your bat for a line drive hit rather than swinging for the fences.

Everything You Want To Know About Exchange Traded Notes (ETNs)

Exchange traded notes (ETNs) are often referred to as the cousin of exchange traded funds (ETFs). Like ETFs, they trade all day on exchanges, tout low fees and give access to challenging areas of the market. But they differ in some important ways.

What Are ETNs?

ETNs are debt instruments backed by the full faith and credit of the issuer. They follow an underlying index or product and anyone can buy them. Since they are debt, if the issuer goes bankrupt, you become another creditor and you’ll have to get in line.

ETNs exist in far fewer numbers than ETFs, and they have attracted about 1% of the assets held in ETFs. One factor that could explain their lesser popularity is the risk associated with investing in them. ETNs are essentially debt instruments, meaning that if the issuing bank goes under, you’ll have to get in line with other creditors for your money.

Here are some of the primary differences between ETFs and ETNs:

  • ETFs have the liquidity that comes with a single stock. ETNs are a debt obligation, so credit risk is a concern investors need to be mindful of.
  • ETFs offer instant diversification because when you purchase one, you invest in a fund that buys and holds multiple assets. This includes, equities, bonds, and commodities. ETNs are not investments in funds; instead, you are buying debt from the issuer and they are backed by the full faith and credit of the issuer.
  • ETNs have maturity dates. When you hold an ETN until the maturity date, you receive a one-time payment based on the performance of the underlying asset, index or strategy. If you wish to sell sooner, you can sell on the open market.
  • When you buy an ETF, you buy ownership of a basket and its contents, not piecemeal ownership of the individual contents. The savings come from trading costs and initial capital that you would need to invest in single stocks.
  • The tax treatment of ETFs and ETNs is different. With ETNs, you are taxed only upon sale. Short-term capital gains rates apply if held for less than one year; long-term capital gains rates apply if held for more than one year. As for ETFs, they could be a little trickier, especially when it comes to commodity ETFs that hold futures and leveraged funds. Doing homework on this is necessary. (There’s more on ETNs and taxes down below).
  • Both ETFs and ETNs give access to hard-to-reach markets, such as currencies and certain foreign markets. One example of the benefits of ETNs is the iPath MSCI India ETN (INP: 60.40 -0.45 -0.74%), which gave investors the ability to gain exposure to a rapidly growing economy before the India ETFs came along.
  • ETNs have no tracking error; this can be very attractive to some investors. However, tracking error has not been a terribly big problem with ETFs.
  • ETNs don’t make interest or dividend payments, and they don’t offer principal protection. No voting rights come with owning ETNs.

What Are Their Advantages?

Despite the risk, though, ETNs do have some big advantages that could make them appealing to investors, Karan Damato for The Wall Street Journal says. These include:

  • Favorable tax treatment for investors seeking commodities exposure. Many commodity ETFs buy futures contracts. Under tax rules, in most futures owe tax on any appreciation each year, even if they don’t sell. Sixty percent of any gain is taxed as a long-term capital gain; 40% is taxed as a short-term gain, at ordinary-income rates. For ETNs, gains are taxed only upon sale, and gains on commodity ETNs held longer than a year are considered long-term, currently subject to a maximum 15% tax rate. The IRS hasn’t specifically addressed the tax treatment of the notes, though, so this could change. Consult your tax professional for advice.
  • Unlike traditional mutual funds, both types of exchange-traded products can be bought and sold all day long like individual stocks.
  • ETNs offer access to tougher areas of the market such as coffee, aluminum  and copper.
  • There’s fairly low credit-risk on notes from larger banks, such as Barclays or Deutsche Bank.
  • Another potential advantage of ETNs is that investors don’t have to worry about “tracking error.” This risk is borne by the issuer.

ETNs and Taxes

You may be familiar with the ETF creation and redemption process, which warrants some discussion before we move onto the ETN creation and redemption process:

  • The creation process of an ETF begins with a prospective ETF manager, or sponsor, filing a plan with the Securities and Exchange Commission (SEC) to create an ETF.
  • Once approved, the sponsor forms an agreement with an authorized participant (AP) - market maker, specialist or large institutional investor - who is able to create or redeem ETF shares.
  • The authorized participant then borrows shares of stock and places them in a trust to form creation units of the ETF.
  • The trust provides shares of the ETF that represent legal claims on the shares held in the ETF. The transaction is an in-kind trade where securities are traded for securities, which means no tax implications, since there was no cash changing hands.
  • Finally, the AP receives the ETF shares, and the shares are then sold to the public as stocks in the open market.

With ETNs, there’s no need for shares to be created or change hands. If more shares are needed, the index provider quotes a net asset value (NAV) and a deal is worked out with the custodian.

ETNs are only taxed upon sale of the fund under normal capital gains rates.  Paul Justice of Morningstar takes it a step further and outlines these helpful basic ETN tax rules (these go for ETNs other than for currency tracking funds):

  • They generally holds no real assets
  • You are taxed only upon sale
  • Short-term capital gains rates are applied if held for less than one year
  • Long-term capital gains rates are applied if held for more than one year
  • They typically do not generate interest or dividend income

As always, we’re not accountants, so consult your accountant for current tax advice.


ANADIGICS Beats Estimates

ANADIGICS, Inc. (NASDAQ:ANAD) reported revenues of $41.8 million in the fourth quarter of 2009, down 7.6% from a year ago but up 13.9% sequentially and surpassed management’s revenue growth guidance of 5% – 8%.

The growth in revenues came from higher-than-expected shipments in each of the main product categories of wideband CDMA, wireless LAN, WiMAX, and cable products.

Wireless revenues came in at $24.9 million, down 5.7% sequentially. Broadband revenues came in at $16.9 million, up 64.4% sequentially and were better than management’s expectations. Within broadband, wireless LAN revenue was $5.7 million, up 90% sequentially. Cable Television (CATV) revenue was $9.9 million, an increase of 46% sequentially and WiMAX revenue came in at $1.3 million.

The top customers for the company included Research in Motion Limited (NASDAQ:RIMM), Intel Corporation (NASDAQ:INTC), LG, Richardson Electronics Ltd (NASDAQ:RELL), Motorola Inc. (NYSE:MOT), Cisco Systems Inc (NASDAQ:CSCO), and Samsung Electronics Co., Ltd.

LG and RIMM each generated more than 10% of total revenues in 2009. ANADIGICS was also able to win back lost market share at Samsung which it had lost in 2008. Samsung was a 10% customer in the second and third quarter of 2009 and continues to be strong in the first quarter of 2010 as well.

Gross margin came in at 29.1%, up 470 basis points sequentially. The increase in gross profit was driven by better-than-expected product yields, lower direct material costs, and better overall product margins from increased revenue. The increase was partially offset by the negative impact of a planned two-week fab shutdown at the end of the quarter.

Net loss came in at $3.2 million or 5 cents per share, much lower than the Zacks Consensus of 14 cents and management’s guidance of a loss of 8 to 10 cents. The lower loss was due to higher revenues and gross margin which positively impacted the bottom-line.

During the quarter, ANADIGICS generated $4.6 million of cash from operations and used $0.8 million in capital expenditures. As of December 31, 2009, cash and equivalents totaled $83.1 million.

Revenue for the year ended 2009 was $140.5 million, down 45.6% from 2008. Net loss per share came in at 54 cents.

Going forward, management stated that the company continues to see strong bookings in the quarter in the wireless product line. Hence, wireless revenue is expected to grow by approximately 20% sequentially. This growth is expected to offset a previously-expected decline in wireless LAN revenue.

Management expects net sales of $41.8 million in the first quarter of 2010. Gross margin is projected around 29% – 30%. Net loss per share is forecasted around 5 – 6 cents.

Headquartered in Warren, New Jersey, ANADIGICS designs and manufactures semiconductor solutions for the broadband wireless and wireline communications markets.

SurModics Downgraded

We recently downgraded our recommendation on SurModics (NASDAQ:SRDX) to Underperform. Although SurModics’ first quarter earnings (after adjustments) of fiscal 2010 came in at 5 cents above the Zacks Consensus Estimate, we are concerned about the company’s top line growth. 

SurModics earns more than 60% of its revenues from the cardiovascular segment. Although this segment reported a marginal year-over-year growth of 3% during the first quarter of 2010, the past trend has not been as encouraging due to severe competition in the stent market. We believe the competitive landscape in the stent market will keep revenues of the cardiovascular segment volatile. 

Moreover, we are concerned about the termination of its agreement with Merck (NYSE:MRK), which related to the development and commercialization of a drug delivery system for the treatment of serious retinal diseases. Although Merck’s decision was made following a strategic review of its business and product development portfolio and did not relate to the safety or effectiveness of any of SurModics’ drug delivery systems, we remain concerned about the company’s current partnership programs. Additional terminations of partnership agreements will hit the company’s top line. 

Although we are quite upbeat about SurModics’ agreement with Roche to develop and commercialize a sustained drug delivery formulation of Lucentis (ranibizumab injection), we doubt its ability to record revenue growth in the near future. 

Recent revisions in 2010 earnings estimates for SurModics have followed a strong downward (negative) bias. Over the last 30 days, 7 of 8 analysts following the stock have reduced their estimates for fiscal 2010, with only one analyst moving in the opposite direction. If annual results come in line with expectations, 2010 EPS would be 38% below the year-earlier level. 

For the second quarter of 2010, the Zacks Consensus Estimate is 16 cents, representing a year-over-year decline of 33.3%. Over the last 30 days, 6 of the 8 analysts following the stock have reduced their estimates for the quarter, with 1 analyst doing the reverse. Since the termination of its agreement with Merck, SurModics has witnessed a steep decline in contribution from the ophthalmology segment, hitting its top line, a trend we expect to continue in the forthcoming quarters.

Wright Beats Zacks Estimate

Wright Medical Group, Inc. (NASDAQ:WMGI) reported fourth quarter and full fiscal 2009 results. For the fourth quarter, earnings per share were 27 cents, beating the Zacks Consensus Estimate of 19 cents. However, earnings were lower than the year-ago figure of 31 cents.  For fiscal 2009, earnings per share were 85 cents, compared to the Zacks Consensus Estimate of 60 cents and the year-ago figure of 92 cents.
 
Quarterly results
 
Total revenues in the fourth quarter increased 8.0% year over year to $129.9 million, ahead of the company’s guidance of $122 million to $127 million. Excluding a favorable impact of foreign currency translation (FX), net sales increased 5% year over year.
 
Excluding Biologics products, total revenues increased across all business segments. Hip, Knee, Extremity and Other products increased 7.0%, 5.6%, 21.9%, and 6.8% year over year, respectively. Biologics product revenue declined 1.9% year over year in the reported quarter.
 
Hip, Knee and Extremity are Wright’s three largest business segments that contributed 34.5%, 24.2% and 23.3% to total revenues in the fourth quarter of 2009, respectively.
 
Wright witnessed a contraction in margins in the fourth quarter. Gross margin declined 10 basis points (bps) year over year to 70.7%. Operating margin declined 480 bps year over year to 3.5%.
 
Fiscal year results
 
Total revenues in fiscal 2009 increased 4.7% year over year to $487.5 million. Excluding Biologics and Other category, growth was registered across all business segments.
 
On a geographic basis, the U.S. contributed roughly 61.5% to total revenues and increased 6.2% year over year. International revenues increased 2.4% year over year.
 
Wright ended fiscal 2009 with cash, cash equivalents and short-term marketable securities of $171.2 million, an increase of 17.7% year over year. The company reported a free cash flow of $10.8 million in the fourth quarter and a record $34.6 million in fiscal 2009.
 
Outlook
 
Wright expects total revenues between $515 million and $530 million in fiscal 2010, an increase of 6% to 9% year over year. Earnings per share should range between 88 cents and 94 cents, an increase of 4% to 11% year over year.
 
Wright Medical is a global orthopedic devices company specializing in the design; manufacture and marketing of reconstructive joint devices and bio-orthopedic materials.

The orthopedic industry is highly competitive, and Wright Medical faces challenges from large players, such as, Zimmer Holdings Inc. (NYSE:ZMH), Stryker Corp. (NYSE:SYK), Johnson & Johnson/De Puy (NYSE:JNJ)Smith & Nephew plc. (NYSE:SNN) and Biomet.

Presently, we have a Neutral recommendation on Wright Medical.

The US Jobless Recovery Still Endures

Stocks have staged surprise rebounds after seemingly poor payroll reports half a dozen times in the past year. But the one time that there was better-than-expected job news, on Dec. 5, the market tanked. Go figure - it’s a great example of how upside down the logic is on Wall Street.

To help us interpret the jobs report of last week, I turned to my favorite independent labor analysts, Philippa Dunne and Doug Henwood. Here’s their view of the latest numbers, which they considered the most positive in months - despite the many problems highlighted by the latest jobs report.

Let’s analyze some of the highlights - and lowlights - of the most recent report:

  • The headline job loss of 20,000 jobs was driven by losses of 75,000 in construction, mostly in non-residential, with large losses in specialty trades (those who finish buildings). Heavy and civil construction both were flat, which makes you wonder where the StimPak [stimulus package] is going. Manufacturing added 11,000, its first positive month in three years, led by motor vehicles. Retail added 42,000, with no single sector hogging the gains. Transportation and finance had modest losses. Healthcare added just 15,000 jobs, slightly below the sector’s average over the last year, and private education lost jobs.
  • Temp firms were real standouts, adding 52,000 workers, continuing their strength.  Temp agency Kelly Services Inc. (NASDAQ:KELYA) hit a new 52-week high last week, reflecting the strength of temp employment in the jobless recovery.  In fact, temp employment is on the verge of going positive year-over-year, which would be the first time that’s happened since early 2007. Let’s hope this is a harbinger of broader payroll gains, and not just a new regime of throwaway jobs.
  • The federal government added 33,000 workers - 9,000 of them for the U.S. Census -  with the total partly offsetting losses of 41,000 at the state and local level. Given the fiscal situation at the sub-federal level, we can probably expect more of the same.
  • Diffusion indexes (positives less negatives) posted nice across-the-board gains, with the one-month measure at its highest level since March 2008. The 12-month index is still a laggard, but it’s at its highest level in eight months. These suggest some firming in the labor market’s internals.
  • Average hourly earnings for production workers rose 0.3%, while the measure rose and 0.2% for all workers. The yearly changes are 2.5% and 2.0%, respectively. Wage pressures are nonexistent, which is great to hear if you’re worried about inflation, but isn’t so great if you’re a worker hoping for a nice raise.
  • The average workweek rose 0.1 hours for both production workers and for all workers. This is the longest workweek in the production-worker series in a year. Aggregate hours rose nicely for both sets of workers in the major sectors, and the yearly decline in aggregate hours for production workers is its smallest since October 2008. The rise in the workweek, which is starting to look like a trend, portends well for future hiring.
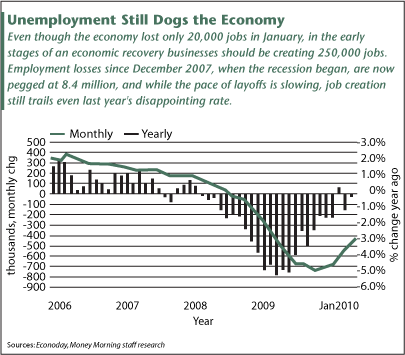
  • Employment losses since December 2007, when the recession began, are now pegged at 8.4 million, or 6.1% of total employment. That’s the worst since the post-war demobilization recession of 1945, and nearly three times the average job loss in post-1950 recessions.
  • The labor participation rate was up 0.1 point and the employment/population ratio rose a nice 0.2 percentage points, its first increase since last April. While it’s too early to say whether this strength in the household survey is a harbinger of an upturn that will soon show up in payrolls, it’s something to be filed under “tentatively encouraging.”
  • The unemployment rate declined a sharp 0.3 percentage points to 9.7% — all of it clean, meaning there wasn’t any rounding funniness, or pop-control distortions. “Hidden” unemployment declined even more markedly, with the broad U-6 rate falling a sharp 0.8 points to 16.5%.
  • The job-finding rate (the probability of a person unemployed in December finding a job in January) rose by three points to 24.5%, its highest level in six months. It looks like we’re seeing more concentration in the very-long-term unemployed, defined as those who were jobless for 27 weeks or more.

All in all, Dunne and Henwood conclude, this was a pretty good report by the standards of the last couple of years. In more normal times, this report wouldn’t be any cause for cheer, they observe. But it does support hopes that the labor market is turning.

The problem, however, is this: During a normal expansion of a healthy economy, monthly payrolls typically rise as much as 150,000 a month. But during the early stages of a recovery, gains are expected to exceed 250,000 per month.

In contrast, at best the economy shed 25,000 last month in what is supposed to be a recovery. And it might be worse. TrimTabs Investment Research, an economic-research firm based in the San Francisco Bay Area, reports that its data, based on records of real-time tax receipts, shows that job losses last month actually totaled 104,000. TrimTabs Chief Executive Charles Biederman says he believes the public is being lulled into a false sense of improvement by incorrect federal jobs reporting.

”By the time everyone wakes up to the fact that the economy is not recovering, the damage will already have been done,” he says.

Since payrolls are still shrinking - even though the economy is supposedly improving - something is really wrong. At minimum, the recovery in employment is going to take a lot longer than the recovery in the economy, and every month that goes by there’s even more ground to make up.

Bad In The Broadest Sense

It’s true, as Barry Ritholtz notes in “Deficit Hawks Want New (or Double Dip) Recession,” that the world is suddenly rife with warnings about fiscal irresponsibility from people who didn’t have a lot to say on the topic before the financial crisis erupted.

That said, those of us who were warning about financial Armageddon when others in Washington and elsewhere were oblivious made it clear that the real concern was the huge gap between the retirement-related promises Washington had made and the resources that were available to meet them.

In “U.S. Headed Toward Bankruptcy, Says Top Budget Committee Member (Must See Video),” The Daily Bail points us to a video that sheds some additional light on just how bad things are in the broadest sense.

Video: Wisconsin Rep. Paul Ryan, ranking Republican on the House Budget Committee, says the current fiscal path will bring the U.S. government to bankruptcy.

As Ryan explains, the nuts are the unfunded liabilities — promises without revenue. One of the better discussions I’ve seen on the issue. Set aside a few minutes.

  • “We know that for a fact.  All the actuaries, all the objective scorekeepers of the federal government, are predicting bankruptcy.”
  • “They say we are $53 trillion short of fulfilling the promises the government is making to the American people, in today’s dollars.”
  • “Meaning that if we want to keep the promises of Medicare, Medicaid and Social Security, which are basically the three major entitlement programs, today we would have to set aside $53 trillion dollars and invest them at Treasury rates in order to do it.”
  • “By the time my three children – who are three, five and six years old—are my age, the federal government will have to tax 40 cents out of every dollar made in America just to pay the bills for the federal government at that time.”
  • “The legacy of this country has always been that each generation confronts the challenges before it so that the next generation is better off,” said Ryan. “In the past, we brought down the Iron Curtain and won the Cold War.  We got through World War I. We got through World War II.  We won the war on the Great Depression.”
  • “The problem that we have right now—putting foreign policy aside and our fight with Islamic radicalism—is that we have an economic crisis, we have a fiscal crisis, and, that is, we will bankrupt this country, and the best century in America will be the last century,” he added.”

Forex Trading: USDJPY Tests Highs At 92.08

gregmike-00509

The USDJPY is up testing the highs for the day at 92.08. A move above will next target the 92.30 level where the  200 day MA is found for the pair.  Keep this level in mind.

gregmike-00510

The 100 and 200 bar MA on the 5 minute chart remains at 90.83.  If the price remains above these moving average lines, the bias remains to the upside.

Initiating BP At Neutral

We have recently initiated coverage on BP Plc. (NYSE:BP) with a Neutral recommendation and $55 target price. 

London, England-based BP Plc (BP) is one of the world’s largest energy companies, providing its customers with fuel for transportation, energy for heat and light, retail services and petrochemical products. It operates in three segments: Exploration and Production, Refining and Marketing, and Other Businesses and Corporate. 

BP has maintained an industry leading track record for long in terms of reserve replacement ratio; its 2009 ratio was 129%. 

BP has been successfully accessing substantial new resource opportunities including a major new entry into Iraq with Rumaila field, one of the greatest oil fields of the world. Additionally, exploration success in Tiber discovery, a giant field in Gulf of Mexico (GoM), coupled with appraisal success on Mad Dog South helps to underpin the potential for continued growth in the deepwater GoM. 

The company’s cash flows showed an increasing trend despite a weak natural gas price environment, reflecting management’s ability to properly balance sources and use cash. In addition, with management’s determination to drive down costs, we believe that BP is well positioned for growth. 

Despite higher refinery utilization rate, the weak refining margin environment continues to weigh on the stock and offer limited upside from current levels.

Initiating BP At Neutral

We have recently initiated coverage on BP Plc. (NYSE:BP) with a Neutral recommendation and $55 target price. 

London, England-based BP Plc (BP) is one of the world’s largest energy companies, providing its customers with fuel for transportation, energy for heat and light, retail services and petrochemical products. It operates in three segments: Exploration and Production, Refining and Marketing, and Other Businesses and Corporate. 

BP has maintained an industry leading track record for long in terms of reserve replacement ratio; its 2009 ratio was 129%. 

BP has been successfully accessing substantial new resource opportunities including a major new entry into Iraq with Rumaila field, one of the greatest oil fields of the world. Additionally, exploration success in Tiber discovery, a giant field in Gulf of Mexico (GoM), coupled with appraisal success on Mad Dog South helps to underpin the potential for continued growth in the deepwater GoM. 

The company’s cash flows showed an increasing trend despite a weak natural gas price environment, reflecting management’s ability to properly balance sources and use cash. In addition, with management’s determination to drive down costs, we believe that BP is well positioned for growth. 

Despite higher refinery utilization rate, the weak refining margin environment continues to weigh on the stock and offer limited upside from current levels

SurModics Downgraded

We recently downgraded our recommendation on SurModics (NASDAQ:SRDX) to Underperform. Although SurModics’ first quarter earnings (after adjustments) of fiscal 2010 came in at 5 cents above the Zacks Consensus Estimate, we are concerned about the company’s top line growth. 

SurModics earns more than 60% of its revenues from the cardiovascular segment. Although this segment reported a marginal year-over-year growth of 3% during the first quarter of 2010, the past trend has not been as encouraging due to severe competition in the stent market. We believe the competitive landscape in the stent market will keep revenues of the cardiovascular segment volatile. 

Moreover, we are concerned about the termination of its agreement with Merck (NYSE:MRK), which related to the development and commercialization of a drug delivery system for the treatment of serious retinal diseases. Although Merck’s decision was made following a strategic review of its business and product development portfolio and did not relate to the safety or effectiveness of any of SurModics’ drug delivery systems, we remain concerned about the company’s current partnership programs. Additional terminations of partnership agreements will hit the company’s top line. 

Although we are quite upbeat about SurModics’ agreement with Roche to develop and commercialize a sustained drug delivery formulation of Lucentis (ranibizumab injection), we doubt its ability to record revenue growth in the near future. 

Recent revisions in 2010 earnings estimates for SurModics have followed a strong downward (negative) bias. Over the last 30 days, 7 of 8 analysts following the stock have reduced their estimates for fiscal 2010, with only one analyst moving in the opposite direction. If annual results come in line with expectations, 2010 EPS would be 38% below the year-earlier level. 

For the second quarter of 2010, the Zacks Consensus Estimate is 16 cents, representing a year-over-year decline of 33.3%. Over the last 30 days, 6 of the 8 analysts following the stock have reduced their estimates for the quarter, with 1 analyst doing the reverse. Since the termination of its agreement with Merck, SurModics has witnessed a steep decline in contribution from the ophthalmology segment, hitting its top line, a trend we expect to continue in the forthcoming quarters.

J.C. Penney Beats, Outlook Positive

J.C. Penney Company Inc. (NYSE:JCP), a leading retailer of apparel and footwear, accessories, fashion jewelry, beauty products and home furnishings, reported fiscal 2009 fourth-quarter results before the opening bell on Friday.

Quarterly earnings came in at 84 cents per share, which declined 10.6% from 94 cents recorded in the year-ago quarter. However, the result surpassed the Zacks Consensus Estimate of 82 cents derived from 13 covering analysts as well as the recent management guidance of 77 cents to 82 cents per share. The better-than-expected result was primarily driven by robust growth in gross margin.

J.C. Penney also provided guidance for full fiscal 2010 as well as the first quarter of the same fiscal. The company expects earnings during fiscal 2010 to be $1.55 per share assuming a low-single-digit increase in same-store sales and flat gross margin rate.

The outlook is well ahead of the Zacks Consensus Estimate of $1.05 per share, which has remained steady over the past 2 months. Shares of J.C. Penney have gained more than 6% to $27.66 in morning trade on the New York Stock Exchange.

For the first quarter of fiscal 2010, J.C. Penney anticipates earnings to range between 16 cents to 20 cents per share assuming a flat to slightly positive same-store sales and marginal increase in gross margin rate from the year-ago period. This guidance is in line with the current Zacks Consensus Estimate of 20 cents per share, which moved up a penny over the past month as one analyst increased while another lowered expectation.

Meanwhile, during the fiscal fourth quarter, total sales dipped by 3.6% to $5.6 billion from $5.8 billion in prior-year quarter, primarily due to a 4.5% reduction in same-store sales. J.C. Penney recorded the most sluggish performance in the home division, and in terms of geography, the Northwest region, while the best results came in at women’s apparel and shoes and in the Central region of the U.S.

J.C. Penney’s gross profit grew by 6.3% to $2.1 billion, while gross margin expanded by 360 basis points (bps) to 38.2%. The growth was mainly driven by prudent management of inventory and promotions.

However, operating income declined by 1.5% to $383 million primarily due to a 1.4% increase in selling, general and administrative expense coupled with the existence of a pension expense of $81 million, compared to a pension income of $24 million in the year-ago period.

J.C. Penney ended the quarter with cash and cash equivalents of $3.0 billion, compared to $2.4 billion in the prior-year quarter. During fiscal 2009, the company deployed $600 million towards capital expenditure, $183 million towards dividend payments and $113 million towards debt repayments.

The company currently operates 1,108 department stores in the U.S. and Puerto Rico. J.C. Penney also operates the largest apparel and home furnishing site, jcp.com, besides the largest general merchandise catalog business.

2010-02-19

Three Reasons Why The Copper ETF (JJC) Is Soaring

Copper prices have continued their impressive rally this week, as the widely-used industrial metal finished higher on Thursday up for the seventh time in eight trading sessions, bringing its return over that period above 15%. The recent surge in copper prices has been driven by a number of factors, and many investors believe that the metal still has room to climb. Copper’s recent run-up is attributable to three primary factors:

1. China’s Insatiable Materials Appetite

Renewed hope that one of the world’s largest users of the metal, China, will continue its rapid consumption have fueled a rise in prices, as the developing economy continues to grow at an impressive rate. Chinese markets have been closed for Lunar New Year celebrations this week, but are expected to climb higher when investors return. Analysts at UBS recently noted that “China is short of intermediate and refined copper products,” and that, “even a modest demand growth scenario for 2010 will require a robust restocking event, almost regardless of the constraints on trade posed by China’s tightening credit markets.” Concerns over China’s next policy moves and a slowdown in growth have weighed on equity and commodity markets in recent weeks, but it now seems that no matter what happens with Chinese monetary policy the demand for copper will continue to be strong.

2. “Restocking” Requirements

Barclays Capital is also very bullish on the metal, with some analysts expecting that copper prices may jump by as much as 34% in 2010. “The combination of growth starting from a very low base and still very stimulative, depression-combating economic policies will continue to support growth at least for the first half of this year,” said Yingxi Yu, an analyst for Barclays in Singapore. “There is likely to be a phase of restocking in the OECD countries, which have gone through a period of aggressive destocking, and that should help to contribute to the growth numbers as well.” Barclays also forecasted global growth of 4.2% for the calendar year, which is far more robust that what several sources were predicting just a few months ago. The revised projections suggest that perceptions of the economy are beginning to turnaround, especially in emerging markets.

3. Impact of Inflation

Finally, recent PPI numbers suggested that inflation is beginning to appear, as the the index of producer prices rose 1.4% for January. The most striking uptick was in the crude goods sector, which was up 9.8% to start the year. This uptick is especially drastic when considering that the index was up a meager 0.4% in December and up just 0.8% for the year. Some investors see the PPI as an accurate forecaster for the CPI, assuming that a majority of the price increases among producers will eventually pass on to the consumers in the form of higher prices (for a guide to other ETFs that may do well in an inflationary environment, see 10 ETFs to Protect Against Inflation).

These three factors have combined to produce copper’s remarkable gain over the past two weeks, leaving investors to wonder if the trend will continue or if rate hikes and trouble in the euro zone will send the metal plunging back down.   As always, investors should remain cautious when dealing with volatile metal markets, keeping in mind that copper could sink just as quickly as it rose over the past 10 days.

JJC

For a complete guide to copper ETF investing, check out our definitive guide to copper ETFs.

Hanger Orthopedic Upgraded

We recently upgraded Hanger Orthopedic Group, Inc. (HGR: 18.14 -0.27 -1.47%) to an Outperform with a target price of $21 based on a P/E of 16.4x our fiscal 2010 EPS estimate of $1.28. 

Hanger recently reported a strong fourth quarter and full fiscal 2009 results. For the fourth quarter, earnings per share were 37 cents, beating the Zacks Consensus Estimate of 36 cents and the year-ago earnings of 26 cents. For fiscal 2009, earnings per share were $1.13, higher than the year-ago earnings of 86 cents. 

Net sales for the fourth quarter increased 10.6% year over year to $205.1 million. Growth can be primarily attributed to higher same-center sales of patient care centers, higher demand for the company’s distribution segment and acquisitions. 

Hanger witnessed an expansion in margins in the fourth quarter. Gross margin increased 60 basis points (bps) year over year to 71.0%. Operating margin increased 160 bps year over year to 13.4%. 

In fiscal 2009, total revenues increased 8.1% year over year to $760.1 million. Patient-care services and distribution segments contributed 88.2% and 11.6% to total 2009 sales, respectively. 

In terms of payor mix: Commercial and other, Medicare, Medicaid and VA contributed 59.5%, 29.1%, 6.2% and 5.2% to fiscal 2009 sales, respectively. 

Hanger Orthopedic is the global premier provider of orthotic and prosthetic patient care services. Hanger competes with Orthofix International NV (OFIX: 34.47 +0.35 +1.03%), Conmed Corp. (CNMD: 22.29 -0.10 -0.45%), Exactech Inc. (EXAC: 17.48 -0.01 -0.06%) and Owens & Minor Inc. (OMI: 46.40 +0.16 +0.35%) in the orthotic and prosthetic space.

Stalemate!

Fundamentals

It appears that Natural Gas traders are already looking towards spring and an end to the traditional gas storage draw season, as not even the withdrawal of 190 billion cubic feet (bcf) last week could spark a rally in Natural Gas futures. The 190 bcf withdrawal appeared bullish — especially when compared to last year’s 44 bcf draw and the 5-year average of 129 bcf of gas taken out of storage. The particularly brutal winter weather in the eastern half of the U.S. has certainly lessened the burdensome supplies of Natural Gas we had going into the winter, with current inventories standing at 2.025 trillion cubic feet (tcf), which is 2.7% above the 5-year average, but only 1.3% above last year’s totals. However, traders seem to be ignoring weather forecasts calling for below normal temperatures in the eastern regions of the U.S. over the next couple of weeks and are focusing on industrial demand, which still has not shown sufficient signs of improvement — at least not enough to placate traders’ fears that gas storage levels will be plentiful once warmer weather approaches. Gas drillers in the U.S. are also starting to increase their operating rig counts, as well, which should keep U.S. gas supplies ample. So unless there is a major supply disruption or industrial demand improves dramatically, Natural Gas futures prices appear to be heading for a consolidation phase until either bullish or bearish fundamentals win out.

Trading Ideas

It sure looks like neither bulls nor bears have the upper hand in the Natural Gas market — at least in the short-term — which sets up potential trading opportunities that may benefit from a sideways market. Looking at a chart for April Natural Gas futures, we notice price consolidation between 6.250 on the highs and 4.600 on the lows. A trader looking for April Gas to continue to trade within these boundaries may wish to consider selling a strangle in April Natural Gas. An example of this trade would be selling the April 6.25 calls and selling the April 4.50 puts. With April Gas selling at 5.216 as of this writing, the strangle could be sold for about 0.058 points, or $580 per strangle, not including commissions. The premium received is the maximum potential gain on the trade. Given the inherent risks involved in selling naked options, traders should have a pre-determined exit point in the event the trade moves against them, such as closing out the trade early if April Natural Gas trades above the call strike price or below the put strike price before option expiration in March.

Technicals

Looking at the daily chart for April Natural Gas, we notice prices forming what appears to be a symmetrical triangle pattern. This chart formation is considered an area of indecision where neither bulls nor bears have the upper hand. Prices are currently slightly below both the 20 and 100-day moving averages, giving a slight edge to gas bears. The 14-day RSI is in neutral territory, with a current reading of 43.74. Minor support is seen at January 28th lows of 5.056, with major support at 4.595. Minor resistance is seen at the February 8th highs of 5.638, with major resistance seen at 6.180.

Mike Zarembski, Senior Commodity Analyst

BIS Economists On “The Future Of Public Debt”

Public debt and spending has become a particularly hot topic recently. The key driver is a ballooning of fiscal deficits on the back of the crisis. Governments around the world have transferred troubled assets from the private sector to the public sector in order to prevent a major meltdown, they have also taken large moves to stimulate demand. But this has worsened existing vulnerabilities in terms of fiscal sustainability. Hot spots have flared up like Greece and Dubai. The worse may still be yet to come.

In these times it is prudent to soak up new information and insights to position yourself to not only avoid loss but, if possible, make gains. This is a review of a BIS (Bank for International Settlements) conference paper entitled “The Future of Public Debt: Prospects and Implications”, by Stephen G Cecchetti, M S Mohanty and Fabrizio Zampolli. This new resource should provide some insights and warnings about the future of government balances and debt positions for investors and strategists. The paper can be found here.

There are a few good charts and tables in the paper which outline current and projected positions under various scenarios e.g. interest expense as a fraction of GDP, inflation expectations, industrial economies’ gross public debt and primary fiscal balances, projected population structure and age related expenditure, CDS spread regressions against various fiscal indicators. I’ve taken two visuals from the report to discuss in this review:

The first one shows projected public debt to GDP, the red dotted line is the baseline scenario, green is a small gradual adjustment, and blue is a small gradual adjustment with age-related spending held constant. There are charts like this for 12 countries, I picked out these two in particular because they’re traditionally seen as solid and safe countries/markets. But if you look at the UK in particular, if things do indeed unfold like this there will be implications (mention these soon), and remember in markets things tend to get priced in earlier than expected…

It’s also worth noting that they found in studying CDS market data that CDS (default risk) spreads were reliably correlated with debt to GDP ratios (whereas previous studies, prior to CDS data coming available, had identified that “For each percentage point of additional public debt, researchers estimate a risk premium increase of between 1.6 and 1.2 basis points.”).

I also thought the above table would be interesting to include as it shows the magnitude of just how hard it will be to solve the problem in the near term. The standouts are the UK, Japan, and Ireland - who would each need to run primary balance surpluses of at least 10% over the next 5 years. Not only would this be politically difficult to do, but it would also adversely impact economic growth (as decreased spending and higher taxes obviously would have the reverse impact of stimulus measures).

But then who would expect the politicians to take the hard road? It’s interesting to see their discussion of issues around fiscal challenges and monetary policy: “two channels through which unstable debt dynamics could lead to higher inflation - direct debt monetisation and the temptation to reduce the real value of government debt through higher inflation.” It seems to me that there is a non-zero probability risk of this sort of ‘approach’ going on at some point.

The other key risks or warnings they discuss, to briefly mention, include:

“In the aftermath of the financial crisis, the path of future output is likely to be permanently below where we thought it would be just several years ago. As a result, government revenues will be lower and expenditures higher, making consolidation even more difficult. But, unless action is taken to place fiscal policy on a sustainable footing, these costs could easily rise sharply and suddenly.”

“large public debts have significant financial and real consequences. The recent sharp rise in risk premia on long-term bonds issued by several industrial countries suggests that markets no longer consider sovereign debt low-risk.”

“the risk that persistently high levels of public debt will drive down capital accumulation, productivity growth and long-term potential growth potential.”

Summary
It’s well worth reading the entire paper, as a lot of detail is missed in this brief review - but hinted at. A key theme of the paper is that prior to the crisis a lot of industrialized nations faced existing structural deficit problems such as the future liability of unfunded aging population related expenses (e.g. pensions, rising health care costs etc). Of course when you add crises to the mix - which tend to increase government deficits and debt (as noted in a study they cited) - the existing problems of structural imbalances only become harder to deal with.

As we’re seeing some of the potential problems unfold in places like Greece, it is therefore necessary to be vigilantly mindful of trends in government spending to set intelligent investment strategy. At the end of the day as an individual you’re probably powerless to alter the course of government policy, but you can and should alter the course of your own personal policies…

Loss Widens At Medicines Co.

The Medicines Company (MDCO: 7.31 +0.09 +1.25%) reported a fourth-quarter loss of $1.40 per
share and a full year loss of $1.38, including the impact of stock-based
compensation expense. Fourth quarter loss was wider than the year-ago loss
of 8 cents and the Zacks Consensus Estimate of a loss of 15 cents.

Although revenues increased, the company reported a wider loss due to the
ApoA-1 Milano deal, milestone payments, license payments, and other costs,
charges related to the Cleviprex recall and its decision to fully reserve
against its deferred tax assets.

Meanwhile, Angiomax sales helped increase fourth quarter revenues to
$102.1 million, up 8.7%. Full year revenues increased 16.1% to $404.2
million. Angiomax, the lead product of The Medicines Company that was
acquired from Biogen Idec, Inc. (BIIB: 56.61 +0.63 +1.13%) in 1996 is used as an anticoagulant
in patients undergoing coronary angioplasty.

The drug recorded fourth quarter sales growth of 9.6% to $96.3 million in
the US. We were pleased to see Angiomax revenues increase on a sequential
basis as well despite the tough economic environment which has led to
cost-cutting by hospitals. We believe that data supporting the
cost-effectiveness of Angiomax is helping the product gain share. However,
Angiomax sales in ex-US markets declined 7.1% to $5.2 million.

For the full year, Angiomax sales increased by 14.6% to $382.9 million in
the US. International markets also recorded growth with Angiomax sales
coming in at $18.3 million, up 34.6%.

Meanwhile, we remain disappointed with the performance of Cleviprex
(clevidipine), the only other marketed drug at The Medicines Company that
received US Food and Drug Administration (FDA) approval in 2008. Cleviprex
is an intravenous drug (calcium channel blocker) intended for the
short-term control of blood pressure in patients undergoing cardiac
surgery.

The drug recorded sales of $0.6 million, down from $1.1 million recorded
in the third quarter of 2009. Full year sales came in at $3 million.

The Medicines Company also announced that it is adopting steps to help
simplify its operating structure. The company has cut down 74 jobs – this
move is expected to generate cost savings of approximately $15.5 million
in 2010.

We were not surprised to see the company refraining from providing any
revenue guidance for 2010 given the generic risk being faced by Angiomax.
Angiomax will most likely lose patent exclusivity in the U.S. in September
2010 (including pediatric exclusivity) and the entry of generics would be
devastating for the company. Angiomax, The Medicines Company’s lead
product, accounted for about 98% of total revenues in 2009.

We currently have a Neutral recommendation on The Medicines Company. Our
biggest concern with the stock is the generic risk for Angiomax.
However, we are pleased to see that management is actively pursuing
in-licensing deals and acquisitions to make up for the loss of revenues
that will take place with the genericization of Angiomax.

While the products acquired/in-licensed by the company are still in
different stages of clinical development, the successful development and
commercialization of these candidates would help sustain long-term growth.

Solid Quarter For Goodyear

Goodyear Tire (GT: 13.46 -0.84 -5.87%) posted a net income of $107 million or 14 cents per share (excluding special items) for the fourth quarter of 2009 in stark contrast to the loss of $287 million or $1.18 (excluding special items) in the same quarter a year ago and the Zacks Consensus Estimate of a loss of 6 cents. The company believes lower raw material costs, improved sales volumes and cost-reduction initiatives contributed to earnings growth.
 
Sales in the quarter rose 7% to $4.4 billion. It reflected positive impacts of $276 million due to an 8% rise in tire unit volume fueled by improved global consumer tire demand and growth in emerging markets and $310 million due to favorable foreign currency translation effects.
 
Goodyear had a segment operating income of $249 million in the quarter compared to a segment operating loss of $159 million in the year-ago quarter. The segment operating income reflected a benefit of $358 million due to lower raw material costs. All the geographical tire segments, except North America, benefited from favorable foreign currency translation effects and higher tire unit volumes.
 
Segment Performance
 
Sales in the North American Tire segment fell 3% to $1.88 billion. Unit sales to original equipment manufacturers (OEMs) decreased 7%. Nevertheless, replacement tire shipments were up 2%. Due to lower sales, the segment showed an operating loss of $27 million. However, this was a $166 million improvement from the prior-year level.
 
Sales in the Europe, Middle East and Africa Tire segment elevated 11% to $1.56 billion. Unit sales to OEMs increased 15%. Meanwhile, replacement tire shipments went up 5%. Operating income in the segment improved by $157 million to $125 million compared to the year-ago level.
 
Sales in the Latin American Tire segment appreciated 25% to $508 million. OEM unit volume rose 39%. Replacement tire shipments were up 26%. Operating income in the segment shot up 65% to $81 million.
 
Sales in the Asia-Pacific Tire segment ascended 28% to $486 million. Unit sales to OEMs improved 36%. Replacement tire shipments were up 11%. Operating income in the segment improved $53 million to $70 million.
 
Annual Results
 
In 2009, Goodyear recorded a net loss of $375 million or $1.55 per share compared to a $77 million or 32 cents in 2008. The loss was broader than the Zacks Consensus Estimate of $1.12.
 
Sales in the year dampened 16% to $16.3 billion. This reflected negative impacts of $1.4 billion due to a 9.5% decline in tire unit volume in North America and Europe, $924 million due to reduction in sales in other tire-related businesses, primarily third-party chemical sales by North American Tire and $699 million due to unfavorable foreign currency translation effects.
 
Segment operating income reduced to $372 million from $804 million in 2008 due to weak industry demand.
 
Product Launches
 
Goodyear successfully launched 62 new products during the year. With this, the company has exceeded its goal of more than 50 new product launches for the year.
 
Four-point Cost Saving Plan
 
As per its Four-point Cost Saving Plan, Goodyear has met the 4-year goal of achieving $2.5 billion in savings in 2009. Further, the company has targeted to achieve gross savings of an additional $1 billion over the next three years. The company also downsized its global work force by approximately 5,700 positions, exceeding its full-year target of 5,000.
 
Financial Position
 
Goodyear had cash and cash equivalents amounting to $1.92 billion as of December 31, 2009, an increase from $1.89 billion as of December 31, 2008. Long-term debt and capital leases were $5.03 billion as of December 31, 2009. Long-term debt to capitalization ratio stood at 85%.
 
Based on the solid results, Goodyear’s stock price appreciated about 3% to $14.30 in the evening.
 

Schlumberger To Buy Smith Int’l?

Oilfield services leader Schlumberger Ltd. (SLB: 63.90 -1.91 -2.90%) is in advanced level of discussion to buy Smith International Inc. (SII: 37.70 +4.35 +13.04%), as per this morning’s Wall Street Journal report. The deal still has chances of not materializing, according to the report.

Though the final numbers have yet to come out, the deal price is hovering around $9 billion, by taking a typical deal premium of 20% on the current market capitalization of Smith.

Following the finalization of the deal, if done, the joint entity’s revenue will be double that of its nearest rival Halliburton Co. (HAL: 31.79 +0.25 +0.79%). The Journal also stated that both Schlumberger and Smith had come close last year at different times to finalize the deal, but left it undecided due to price-related issues.

Both companies are Houston, Texas-based. Smith is engaged in providing a comprehensive line of products and engineering services to the oil and gas exploration and production industry, as well as to the petrochemical and other related industries. Schlumberger provides technology, project management and information services to the global oil and gas industry, including drilling fluids, directional drilling and real-time drilling analysis and project management.

We view the transaction as a win-win for shareholders of both companies, as they would get a more diversified oilfield services exposure. Given that both companies cover the same geographical regions, Smith is a good strategic fit for Schlumberger. In addition, the merger could do away with Smith’s struggle to leverage its international expansion to cross-sell its previously acquired W-H Energy product lines – mostly unconventional gas drilling.


Forex Trading: GBPUSD Trying To Bottom But Not Getting Very Far

gregmike-00504

The GBPUSD fell sharply overnight, but has slowed the declines pace.  This has allowed the 100 bar MA on the 5 minute chart to catch up with the market and the price is currently trading at the level.  The pair did move above the 100 bar MA off the 8:30 data, but remained below the 200 bar MA at the 1.5425 level currently. A move above this level is needed to solicit additional dip buying interest.   A move above would next target the 1.5459 level.

Further up is the floor area prior to the last plunge down. That level comes in at the 1.5533-56.  This ultimately is the key topside resistance.

gregmike-00505

Analog Devices Beats Again

Analog Devices(ADI: 29.75 +0.18 +0.61%) fiscal first quarter results beat the Zacks Consensus estimate by 7 cents. Shares were up over 4% in response to the news.
 
Revenue
 
Revenue of $603.0 million was up 5.5% sequentially and 26.5% year over year. The sequential strength was driven by all markets except consumer, which saw some seasonal softness. The increase from the year-ago quarter reflects a higher level of business, particularly in the automotive and consumer segments.
 
Revenue by End-market
 
The industrial market generated 43% of total revenue (up 16.3% sequentially), driven by broad-based growth across applications, such as instrumentation and process control, test equipment, healthcare, defense and aerospace. Beginning this quarter, automotive revenue is being broken out separately.
 
The automotive segment generated 12% of revenue, growing 4.6% sequentially. The main drivers here continue to be increasing electronic content per vehicle, especially in the areas of infotainment and safety. The company also benefited from some inventory replenishment in the last quarter.
 
Communications generated 22% of total revenue, up 11.8% sequentially. Management stated that although wireless remains the bulk of revenues in this segment, wireline continues to demonstrate steady growth. Within wireless, the major driver in the last quarter was 3G base station deployment all over the world, due primarily to the need for deeper penetration in developing countries and for greater data volume transmission in developed countries.
 
Consumer generated 20% of revenue. Segment revenue was down 17.6% sequentially, due to normal seasonal softness following the holiday season. Revenue exceeded the year-ago quarter by 53.5%.
 
Computing accounted for the remaining 3% of revenue, the 19.4% sequential increase is attributable to the ongoing recovery in the market.
 
Revenue by Product Line
 
Both analog and DSP products grew in the last quarter, albeit at a slower rate than in the Oct 2009 quarter. Converters grew the strongest (up 19.5% sequentially), followed by amplifiers/RF, which grew 15.6%, power management and referencing 7.7% and DSPs 2.7%.  The product lines generated 53%, 25%, 6% and 9% of revenue, respectively. The balance came from other analog products, which were down 49%.
 
Margins
 
The pro forma gross margin was 61.4%, up 470 basis points (bps) from the previous quarter’s 56.7%. The gross margin improvement has been going on for a couple of quarters now and it is mainly driven by higher volumes, which resulted in better utilization rates, a more favorable mix of business, as well as the effect of management’s decision to exit businesses that did not yield sufficient profits.
 
Operating expenses of $192.7 million were higher than the previous quarter’s $183.0 million. However, the operating margin increased 476 bps sequentially to 29.4%. The improvement was mainly due to the higher gross margin, helped by a 17 bp decline in R&D costs as a percentage of sales and partially offset by a 12 bp increase in SG&A as a percentage of sales.
 
The pro forma net income was $136.1 million, or a 22.6% net income margin compared to $105.6 million, or 18.5% in the previous quarter and $66.3 million, or a 13.9% net income margin in the prior-year quarter. The fully diluted pro forma earnings per share were $0.45 compared to $0.36 in the previous quarter and $0.23 in the Jan quarter of last year. The pro forma net income calculations exclude restructuring charges but include stock-based compensation expenses in the last quarter.
 
Including restructuring expenses, the fully diluted GAAP income was $120.5 million or $0.40 per share compared to $105.6 million or $0.36 in the previous quarter and $24.9 million, or $0.09 in the year-ago quarter. The GAAP numbers in the year-ago quarter include a $41 million restructuring charge.
 
Balance Sheet
 
Inventories decreased 3.9% to $243 million, resulting in annualized inventory turns of 3.8X compared to 3.9X at the end of the fourth quarter. Days sales outstanding (DSOs) were down from 48 to 47. Cash generated from operations was around $214 million. The company spent $17 million on capex and $59 million on cash dividends ($0.20 per share) in the last quarter.
 
Guidance
 
The industrial and communications markets are expected to remain strong in the fiscal second quarter and consumer flattish sequentially. Therefore, revenue is expected to be up 5-8% sequentially ($635-650 million) and up 35% from the year-ago period. The gross margin is expected to be 62-63%, operating margins 29-31%, resulting in EPS from continuing operations of $0.48 to $0.51.