imgadp

Top-Hot-Stocks

Hot Article ------ Favorites this page

2009-05-30

Late Day Rallies, The S&P 500 And The VIX

Friday was an interesting trading day, particularly during the last hour of equity trading.

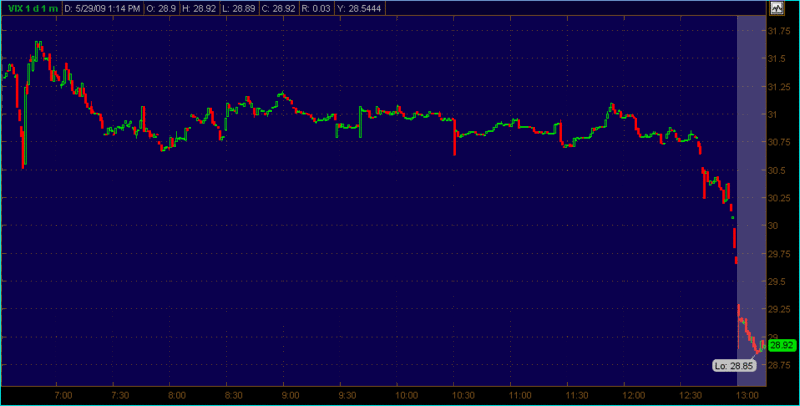
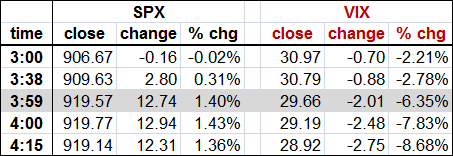
The graphic at the bottom records (in Pacific Time) the intraday movements in the VIX (^VIX: 28.92 -2.75 -8.68%), which was essentially flat for all but the first hour and the last 22 minutes of trading. At 3:00 p.m. ET, the VIX stood at 30.97, down 0.70 (-2.21%) from yesterday’s close. At that same moment, the S&P 500 (^GSPC: 919.14 +12.31 +1.36%) was at 906.67, down 0.16 (-0.02%) for the day.

The SPX began a slow and steady rise at the beginning of the last hour of trading, with the VIX gradually pulling back. The table below captures the changes in the VIX and SPX during that last hour. Note that the VIX, whose values are updated every 15 seconds, begins to move sharply at 3:38, then creates the first of several gaps at 3:41. By 3:59, one minute before NYSE trading closes, the VIX has moved about 4.5x of the percentage change in the SPX, in the opposite direction. At 4:00 the stocks that comprise the SPX stop trading. The daily high of 920.02 for the SPX was recorded in the minute that followed, as some trade data trickled in after the bell. During the two minutes after the close, the SPX was revised down in small increments several times, before being finalized at 4:11.

While the individual components of the SPX stop trading at 4:00, SPX index options trade for an additional 15 minutes in what I like to refer as the twilight zone trading period. This can lead to some interesting VIX prints, particularly if there is a strong move in the SPX toward the end of the regular trading session or if important news breaks during the 15 minute twilight zone. What apparently happened today is that the supply of SPX options overwhelmed demand in the last few minutes of the regular trading session and carried over into the 15 minutes of index options trading. By the time the VIX was finalized, at 4:15 p.m. ET, it had fallen all the way to 28.92, a move that was 6.4x the percentage change of the SPX, in the opposite direction.

Normally, when one sees a dramatic change in the ratio of the VIX to SPX percentage moves, this is indicative of a substantial imbalance in the supply and demand equation for SPX options.

As a side note, those who analyzing historical VIX and SPX data should be aware that the different cutoff times can occasionally lead to some unusual data anomalies.

For additional information, check out a related post on this subject from January: VIX (and VXN) After Hours.

US Monetary Policy Ambiguities

The stance of monetary policy is confusing these days. The target Federal funds rate is near zero, but that’s the nominal rate. With inflation low, the real rate cannot move as far into negative territory as it could if inflation were higher. It’s not “zero bound,” but it’s much closer than usual.

I’ve always regarded monetary policy in terms of growth in the money supply rather than the level of interest rates. Many people insist on calling monetary expansion with low interest rates “quantitative easing,” but to me it’s just that money growth changes are a powerful tool. I don’t know why a special term is needed.

The conventional wisdom is that money growth has exploded in recent months, and the growth in the Fed’s balance sheet is the evidence usually cited. However, most of that balance sheet growth was over in December. We’ve gone almost six months with no further net growth in the balance sheet.

Among the monetary aggregates, the monetary base has grown very rapidly, but the M1 and M2 versions of the money have shown little net growth. Their growth rates went up, but then back down. The monetary base is not something that people spend on goods and services. It is not money, but rather the basis for money growth-bank reserves and currency. While growth in the monetary base is normally followed by growth in various measures of the money supply, times are not normal now. The Fed is paying a nominal interest on reserves, including excess reserves, and banks are seeking more liquidity than usual.  Therefore, bank reserves and the monetary base are growing without translating into money growth.

Dennis Robertson, years ago, wrote about “money sitting” and “money on the wing.”

What we have now is bank reserves sitting and, to the extent new money has been created, money sitting. The velocity of money has dropped sufficiently that money growth has not translated into spending growth. New money doesn’t stimulate the economy if it isn’t spent.

So far, contrary to conventional wisdom, I have pointed out that, 1) the Fed’s balance sheet has not grown, net, in almost six months; 2) the growth in the monetary base has not led to rapid money growth; and 3) the growth in the monetary base is not by itself simulative. The banks and the public are holding onto their bank reserves and money respectively.

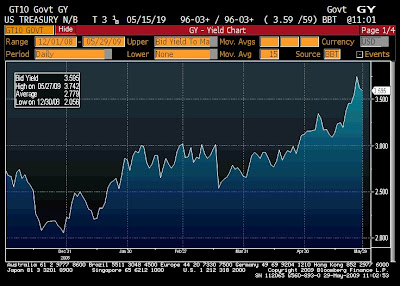
Further complications in our understanding have been introduced by the recent rise in the yield on the 10-year bond. Traditionally, a rise in interest rates would be taken as a sign of monetary tightening, but the interpretation by many now is that it’s a sign of “too much money being printed.” That interpretation, I assume, means a new inflationary premium is being introduced into long rates.

That may be right, but an alternative interpretation, implicit in what I’ve said above, is that monetary policy is still rather tight and the tremendous increase in borrowing by the Treasury has led to higher rates. The public won’t absorb all the new debt with out being paid to do so with higher rates. Right now, I think interest rates reflect excessive borrowing while the money supply is a better measure of Fed policy.

GM Is Finished As Bankruptcy Nears, Shares Slide Below $1

Shares of General Motors (GM: 0.75 -0.37 -33.04%) are off about 20% today as all signs are pointing to the inevitable bankruptcy filing on Monday June 1st. The struggles in Detroit continue to drag down domestic Automakers but GM’s well-publicized cash flow problems and stand-offs with the Federal Government have led to its demise.

Unlike Motor City brethren Ford (F: 5.75 +0.19 +3.42%), GM was unable to reign in enough the costs that had been spiraling out of control as deals with the UAW and CAW only go so far. The cost-cutting pacts with the Canadian union and the ownership agreements with the US Union could not in the end support the business model without an infusion of outside help that wasn’t in sight. Italian car maker Fiat is still interested in GM’s European operations to the tune of a merger with the Opel brand, but without a leg to stand on, General Motors as this generation has come to know it, no longer exists.

The electric Volt will not save the company now, far too little and far too late, all that will happen now is a sell-off of assets to anyone willing to buy. Perhaps GM can pick up the pieces and re-emerge as a brand in-tune with a new generation of motorist, but as a company and especially as a stock in today’s market it is.

Turmoil at GM can only mean good things for competitors, with the company distracted by the slashing of assets, the brokerage of deals & spin-offs and the necessity of brazen survival for workers up and down the corporate chain, the only winners will be other car-makers.

Names like Ford, Toyota (TM: 80.15 +0.64 +0.80%) and Honda (HMC: 29.03 +0.10 +0.35%) should emerge with a stronger competitive advantage while luxury European brands continue to fight for the affluent customer throughout North America. Auto Stocks are all marginally higher today signaling that although one of the Titans of the industry has fallen, the car business will not go away and the remaining horses in the race will not slow down to pick each other up. What sometimes seems like a 0-60 sprint in the car business actually is and I expect the other big automotive companies to not pull any punches when it comes to advertising their strengths, and as is always prudent advice when it comes to investments: Stick with the strong.

Why Junk Bond ETFs Are Suddenly Treasured

Apparently, intrepid investors are developing a growing appetite for riskier investments such as junk bond exchange traded funds (ETFs). After a volatile and scary year, you can’t help but wonder what’s happening.

The yield margins of high-yield bonds over Treasuries are narrowing, as seen on the Merrill Lynch U.S. High Yield Master II index, which shrunk from more than 2.1% in February to 1.2% last Thursday, reports Tom Sullivan for Barron’s.

Demand for these junk bonds have been on the rise and the best performers were in health care and utilities. It is thought that the reason for the rally is that traditional high-yield investors never left the market but stuck it through the toughest of times.

Investors have looked to the riskier single-B securities from the double-B-rated issues. Time will tell if people will be interested in the even more riskier triple-C-rated bonds.

  • State Street’s SPDR Lehman High Yield Bond (JNK: 35.00 +0.14 +0.40%): up 12.2% year-to-date; 13.6% yield
  • iShares iBOXX $High Yield Corporate Bond (HYG: 77.835 +0.575 +0.74%): up 5.7% year-to-date; 11% yield
  • PowerShares High Yield Corporate Bond (PHB: 16.50 +0.16 +0.98%): up 5.4% year-to-date; 11.5% yield

In other bond news:

In California, there is a budget gap of $21.3 billion. The state will cut $5.5 billion soon and a further fill the $26 billion hole over the next two years. The California general-obligation bonds were hovering around 1.5% last Friday.

  • iShares S&P California Muni Bond Fund (CMF: 104.375 -0.101 -0.10%): up 4.3% year-to-date; 3.6% yield

The Treasury’s two-year note dropped to 0.85% last Friday. The 10-year yield closed at 3.43%. A major concern was over the outlook of a weaker dollar and the potential change in country’s debt rating by the S&P.

  • iShares Lehman 1-3 Year Treasury Bond Fund ETF (SHY: 83.92 +0.12 +0.14%): down 0.3% year-to-date; 3.3% yield
  • iShares Lehman 7-10 Year Treasury Bond Fund ETF (IEF: 91.45 +1.02 +1.13%): down 7.7% year-to-date; 3.9% yield

US Dollar Continues To Come Under Broad Based Selling With No Respite In Sight

Yesterday’s (Thursday)  final US treasury auctions of $26bn of 7yr notes went off without a hitch. In a week which saw $101bn of new supply entering the market, investors’ worries were calmed as bid-cover ratio and percentage awarded to indirect bidders matched auctions in the past. So it looks like for now the foreign demand for US debt is unchanged. However, as we had mentioned in the past if there was a shift in central bank policy now would not be the opportune time to make it known. Investors celebrated the non event by trading into equities pushing the S&P (^GSPC: 919.14 +12.31 +1.36%) up 1.54% and 10yrs yields falling to 3.61%. This rally comes on the back of mixed US data, which showed durable good rising 1.9% (prior revised lower to -2.1%) yet mortgage delinquency rose to a new high of 9.1%.

The USD continues to come under broad based selling with no respite in sight. Commodities and commodity currency rallied on renewed risk appetite with the AUD/USD climbing above 0.7950 level. The EUR/USD traded through the 1.4050 resistance and the GBP/USD broke through 1.6100. The media has been buzzing with the speculation that GM (GM: 0.75 -0.37 -33.04%) is planning on filing for bankruptcy protection on June 1st, following the governments attempts to restructure the company. While the move has been widely expected, just the fact that a firm this size would actually file has captured the markets’ imagination. We don’t expect any spillover into risk aversions should the firm move in this direction (as early as Monday).

Yesterday, the Eurozone Consumer, Economic, Industrial and Services confidence indicators came in largely as expected continuing its upwards slope. German unemployment continued to climb, with the ILO figure slightly higher at 7.7% as expected and the headline rate at 8.2%. In Japan , CPI and industrial production data both surprised to the upside. The National headline CPI fell by only 0.1%y/y, a figure that might help ease deflation fears. However, the BoJ is well aware that the country is not in the clear just yet . Industrial production managed a 5.2%m/m expansion, pushing the y/y figure to -31.2%y/y, slightly better than expectations. The unemployment rate, however, increased to 5 .0 % from 4.8% previously, the highest level in over 5 1/2 years. And as the government has expressed, along side recent economic upgrades, that without a recovery in the labor markets the downside risk to the economy is still a reality.

Today, US preliminary Q1 GDP, Chicago PMI and the University of Michigan confidence index come out and as the markets are watching for more proof of green shots, these will be critical.

Forex-Chart

The Risk Today:
Eur/Usd pair blew through all near term resistance in european session as the USD was sold across the board. Break above 1.4057 high reinstates bullish theme. Little resistance until 1.4180 then on to 1.4220. 1.4050 should act as intraday support.

Gbp/Usd following the eur’s lead, the pair took out resistance. A weekly close above 1.6040 suggest further gains to 1.6195 then a trigger to 1.6310 area. 1.6089 should act as intraday support.

Usd/Jpy in this USD bearish environment Jpy was able to reverse in cloud cover. A break of 95.66 span and trendline support suggests move a move back to 94.00 key support.

Usd/Chf downside pressure easily broke 1.0811, an currently is probing 1.0707 ahead of 1.0611. Intra-day heavy below 1.0953. <!–

Stocks Confound And Confuse

On Tuesday, we were all stock traders, by Wednesday we were all bond traders, and by Thursday we were simply confused traders. Riddle me this: we get news of record U.S. mortgage delinquencies (12%), house prices declining at a record pace in Q1, continuing jobless claims holding climbing to a record 6.8 mn , a disappointing new homes sales number, oil creeping back above $65 barrel (so expect oil stock to be up today) and the Dow (^DJI: 8500.33 +96.53 +1.15%) closes up 103 points?

Call me an old cynic, but in line with the views expressed by Art Cashin on CNBC, I believe the recent rally is almost entirely based upon speculators, suckers and gamblers betting on low quality names. Call it cash for trash but yesterday’s move was just garbage. But maybe I’m just Mr rear view mirror.

Today’s Market Moving Stories

  • The WSJ reports that some Fed officials believe the back up in yields recently reflects a mending economy and a receding risk of financial catastrophe, suggesting they may not rush to step in the way by expanding Quantitative Easing. The FOMC’s Fisher said foreign demand for USTs ( US Treasury Notes) remains strong, adding that he did not think the US would get downgraded.
  • Overnight Japanese April Industrial output rose 5.2%mom compared with a 1.6% gain in March with METI suggesting the May outcome will show an 8.8% gain. April real household spending fell 1.3% yoy while the April unemployment rate rose to 5% from 4.8%. Deflation is persisting as Core CPI fell 0.1% yoy in April.
  • UK house prices: up 1.2% mom according to Nationwide, first bounce in house prices since Nazareth won the Cup. Still it is down 11.3% yoy and seasonally, we tend to
    see more buying in early summer. For the moment however think that low volumes skew size of movement.

Auto Action in Germany
FT Deutschland leads with a news report that Fiat is effectively no longer actively considered to be a candidate for the takeover of Opel, but that the situation remained unclear. There is continued uncertainty about the stance of the US government, and it is not excluded either that Opel might follow GM into bankruptcy. There is huge anger in Berlin over the US, which apparently sent a junior negotiator to the marathon meetings, who was not empowered to make any deals. There is another potential bidder, the Chinese car maker BIAC, which has been asked to provide a detailed concept next week.

The newspaper said in a front page comment that the Germans should not be surprised since the interest of the US government and of GM are not exactly the same of those of Germany’s politicians ahead of a general election. A Chinese bid is also not very likely, as this would cause problems for GM’s future market position in China.

Heavy Metals drop in China

Posco has accepted Rio Tinto’s iron ore price cut of 33% for fine and 44% for lump after Nippon Steels earlier settlement. For the past 40 years, annual iron ore price contracts were set by the first settlement between a big mill and a miner. This secured supply and reduced price volatility, but as spot iron ore prices collapsed last year, spot has traded at a large discount to the contract price. Chinese steelmakers, the world’s largest consumer, have threatened to abandon contracts and move to spot pricing unless the miners accept a 40-50% price cut. It is still uncertain if the Chinese will follow the benchmark, hold out for a larger cut or move to the spot market, but Posco’s settlement increases the chance of acceptance by Chinese mills.


More Bad News at Anglo?

Anglo Irish Bank is expected to reveal a substantial interim loss later today. Media reports suggest loan losses for the six months to March may exceed €4bn ‘even worse than previously feared’, driven by loan concentration.
This would largely erode Anglo’s €4.9bn core equity base. A key focus will be how this fits with the NAMA process - i.e. whether losses recognised at this stage on its property development book of over €18bn will limit the ‘haircut’ on transfer to NAMA - and the resultant capital requirement.

Tullow Oil Seeks A Partner
According to media reports, Tullow Oil held an AGM yesterday and commented that it’s likely to seek a partner to speed up the development of its Ugandan interests when it brings them close to production next year. The group expects to spend up to €750 million developing its resources this year, including the Jubilee and Tweneboa fields in Ghana, which have potential reserves of up to three billion barrels of crude oil. The CEO, Aidan Heavy, said Tullow will sell half of its holding to a partner in order to bring the fields to full production. This partner will fund the pipeline.
Mr Heavey said the company was likely to begin the process of finding a suitable partner for the deal next year, when the wells there are nearing production.

Greencore may be getting out of the water!

There is also Irish media report that Greencore may sell the UK water business which was the source of controversy in 2008. Its water unit operates under the Campsie Spring brand and is a major supplier of own-label waters to key UK retailers. It bottles about 200m units yearly and has had sales of over €40m. A price tag of £10-£20m is quoted which could be used to further erode group debt which was €332m at the half year. Proceeds could also provide funds for the planned build-out of the group’s US food manufacturing assets

Smurfit Kappa Extends Banking Cover.

The Irish Independent reports this morning that Smurfit Kappa is in talks with lenders about easing its banking terms to allow “additional headroom” on the groups €3.1bn in debt. The group had previously indicated that they were trading “comfortably” within its covenants, but the measure is said to be considered due to the deteriorating seen in its main markets and to help soothe investor fears about the possibility of breaching those covenants.

The paper also reports that that a number of Smurfit’s rivals are threatening to flood the market for containerboard by increasing capacity at a time of heavy contraction in the industry

Some Sultry Summer Reads
Here is some recommended reading from nakedcapitalism. No airport novelettes included.

  • Animal Spirits by George Akerlof and Robert Shiller
  • Bailout Nation Barry Ritholtz
  • Lecturing Birds on Flying: Can Mathematical Theories Destroy the Financial Markets? Pablo Triana
  • Mr. Market Miscalculates: The Bubble Years and Beyond James Grant
  • When Giants Fall: An Economic Roadmap for the End of the American Era Michael Panzner

North Korea paints the town red

Data Ahead Today

  • Euro area M3 money supply, Apr (09:00 BST): M3 was likely flat, consistent with a 4% rise from a year ago. Growth in private sector loans should slow further from 3.2 to 2.5% yoy.
  • Euro area CPI, May (10:00 BST): Inflation should surprise with a flat result (consensus: 0.2% yoy), the lowest result in the history of the EMU. Currently, inflation is negative in seven euro area countries.
  • US GDP (revised), Q1 (13:30 BST): Like the market, I expect a slight upward revision to a still-alarming annualised fall of 5.4%
  • US Chicago PMI, May (14:45 BST): Manufacturing should contract at a slower rate as the PMI rises to 42.
  • US Michigan consumer confidence (final), May (15:00 BST): Sentiment should continue to improve, rising to 69.
  • Earnings from Tiffany’s ($0.20)

A Buying Frenzy Driven By Interest Rates?

The theme for the past few days has been rising long interest rates in the US, particularly the long end. Just 2 days ago, S&P (^GSPC: 919.14 +12.31 +1.36%) closed below 900 as yield begun its ascend, troubling some investors that rising long term rates at this juncture could harm recovery.

Just where the recovery is coming from is another question SFOT could not bring to discuss at this moment. Having met a few contact from the HF world yesterday and hearing them arguing in the most convincing way why this rally in all asset classes have no legs, only to admit they are long in most asset class as the trend is so, suggests going against this upmove is treacherous.

At this juncture, SFOT would guess rates should play a bigger role in determining global asset direction, i.e lower rates = all asset classes rallying, which is happening this morning in london.


In oil, we have seen another big draw in DOE crude inventories, which is the 4th consecutive draw in May. One would suspect this is the beginning of a trend which should see stock level continue to draw and it please OPEC to the extend they do not need to cut anymore production. Prices rallying to $66 today also provide a better receipt than just 2 months ago for OPEC countries as they are now sitting more comfortably. SFOT sees stocks continue to draw down on crude, only due to supply cuts.

With prices here, the potential for demand to take further hits will be bigger and thus the economics for products that are already having a supply overhang is going to be worse, i.e middle distillates. Although SFOT is more bullish gasoline, he is now rethinking if prices at almost $2 /gal will have a bigger detrimental effect on demand. Looking at the charts below suggest that other than the last data point, we have not seen any seasonal pickup in Gasoline demand yet.

2009-05-29

GM May Be Heading For Quick, Pre-Packaged Bankruptcy

General Motors Corp. (GM: 1.12 0.00 0.00%) appears to be heading to bankruptcy court for a quick pre-packaged bankruptcy. This is after the bond holders who hold $27 billion in debt agreed to an offer that would give them 10% of the restructured GM with an ability to take it to 15% with warrants. They must agree that assets will be sold to a new company in bankruptcy (good GM/bad GM).

This is lower than the 58% ownership that they were looking for originally. It is also believed that there are treasury incentives to back up the bondholders. GM indicated that it may not make $1 billion of debt payments on June 1. However, it is believed that this will be covered by the Government.

The Government is likely to hold 70% of the equity of GM post bankruptcy, which is reimbursement for $20 billion already given to the company and an expected $40 billion more when a filing occurs. Some is this will be for the under-funded pension, which is near $13 billion. The UAW will have 20% of the company.

Pontiac will be phased out, while negotiations to sell Hummer and Saab continue.  GM will emerge with $25 billion of secured debt post bankruptcy.

Overall, Ford (F: 5.56 0.00 0.00%), Honda (HMC: 28.93 0.00 0.00%), Nissan (NSANY: 11.79 0.00 0.00%) and Toyota (TM: 79.51 0.00 0.00%) are likely to be beneficiaries from any lost sales, although a quick bankruptcy may keep this to a minimum (there are rumors that Chrysler is close to an exit).

Major suppliers that could impacted in the near-term with lower volumes are: Magna (MGA: 32.54 0.00 0.00%), Lear (LEA: 1.40 0.00 0.00%), American Axle and Manufacturing (AXL: 2.16 0.00 0.00%) and ArvinMeritor (ARM: 2.42 0.00 0.00%).

Thursday’s Market Recap: Stocks, Crude Oil And Gold Are Up

The markets had a good day, with the NASDAQ (^IXIC: 1751.79 0.00 0.00%) up 1.20%.  The S&P (^GSPC: 906.83 0.00 0.00%) was up 1.54% closing at 906.83, while the Dow Jones Industrial Average (^DJI: 8403.80 +103.78 +1.25%) was up 1.25% finishing at 8403.80.  The 10-year saw prices rise over a dollar, as the yield fell to 3.620% on successful 6-month T-bill announcements and closings of attractive bid to cover ratios from the previous week.  Crude oil and August gold were both up, settling at $65.08 and $963.20 respectively.  Crude oil advanced on an inventory drawdown that was almost five times what was expected by analysts.

General Motors (GM: 1.12 0.00 0.00%) announced that they have reached a new debt-for-equity agreement with bondholders today that would give the debt holders 10% in equity of the new GM company and the ability to buy 15% more of the company’s equity.  It has been reported that a group representing 20% of the debt holders has accepted the agreement, with the remaining debt holders needing to accept the offer by the 5 P.M. deadline this Saturday.  The GM bondholders like this deal better than the previous deal, 225 share of common stock for every $1,000 in debt because the first deal was an attempt to avoid bankruptcy, while this deal is a prepackaged bankruptcy.  The US Government will receive 72.5% of the company and lend General Motors an additional $50 billion dollars. The United Auto Workers Union will receive a 17.5% in the company with an option to buy 2.5% more.  Bankruptcy proceedings for GM could start as early as this coming Monday, with GM not being a publicly traded company for the time period starting this weekend up to following 18 months.

Time Warner (TWX: 23.55 0.00 0.00%) started moving forward with its announcement that it would spin off its AOL unit into a separate publicly traded company.  Time Warner acquired AOL eight years ago, and shareholders have recently been calling for a spin-off of the struggling unit, as shareholders want Time Warner to focus on its content creation, film, and television businesses.  The spin-off of AOL will start after Time Warner acquires 100% control of AOL by buying back a 5% ownership that Google (GOOG: 410.40 0.00 0.00%) currently holds.  After this, Time Warner will begin to spin-off AOL in an effort to complete the process by the end of 2009.  AOL has recently transformed from a provider of dial-up internet to a web portal, which makes most of their money from advertising.  In the most recent quarter ad revenue was down 23% for AOL.  AOL is currently estimated to be worth $5.5 billion, down from the $106 billion that Time Warner paid for them in 2000 and from the estimated $20 billion they were worth in 2005, when Google bought its 5% stake.

In earnings news, Dell (DELL: 11.48 0.00 0.00%) was up over 0.5% afterhours when they announced earnings of $290 million, or $0.15 per share, down from net income of $784 million, or $0.38 per share the same period the year before.  Dell missed analysts estimates on both earnings and revenue; revenue fell 23% to $12.3 billion opposed to the estimated $12.6 billion and $0.22 per share.  Sales were down in PC’s, laptops, and servers falling 34%, 20%, and 25% respectively from the same quarter the year before.  The Texas based computer giant has been suffering significantly during the economic turmoil, down over 47% since the beginning of September.

US Tax Revenue Drops: Not Much Doubt In These Numbers

Although there are many measures of economic activity, the amount of money being remitted to the government through payroll and other taxes not only tells us how the population at large is doing, but it also gives us insights about our nation’s fiscal health. Unlike other official statistics, this relatively timely series appears to be free of at least some of the adjustments, plug factors, and distortions that can spur doubts about what is really going on.

With that in mind, the following USA Today report, “IRS Tax Revenue Falls Along with Taxpayers’ Income,” would seem to put paid to the notion that a rebound is at hand.

Federal tax revenue plunged $138 billion, or 34%, in April vs. a year ago - the biggest April drop since 1981, a study released Tuesday by the American Institute for Economic Research says.

When the economy slumps, so does tax revenue, and this recession has been no different, says Kerry Lynch, senior fellow at the AIER and author of the study. “It illustrates how severe the recession has been.”

For example, 6 million people lost jobs in the 12 months ended in April - and that means far fewer dollars from income taxes. Income tax revenue dropped 44% from a year ago.

“These are staggering numbers,” Lynch says.

Big revenue losses mean that the U.S. budget deficit may be larger than predicted this year and in future years.

“It’s one of the drivers of the ongoing expansion of the federal budget deficit,” says John Lonski, chief economist for Moody’s Investors Service. The Congressional Budget Office projects a $1.7 trillion budget deficit for fiscal year 2009.

The other deficit driver is government spending, which, the AIER’s report says, is the main culprit for the federal budget deficit.

The White House thinks that tax revenue will increase in 2011, thanks in part to the stimulus package, says the report from AIER, an independent economic research institute. But it warns, “Even if that does happen, the administration also projects that government spending will be so much higher each year that large deficits will continue, and the national debt held by the public will double over the next 10 years.”

The government may have a hard time trimming spending to reduce the deficit when the recession ends. The 77 million Baby Boomers- those born in 1946 through 1964 - will start tapping their federal retirement benefits soon, which means increased government outlays for Social Security and Medicare.

“It will be doubly difficult for federal government to reduce expenditures and narrow the deficit as rapidly as they did following previous recessions,” Lonski says. At the end of the last major recession, in 1981, Boomers were in their 30s. Their incomes were expanding, as was their appetite for goods and services.

The Boomers now are in their 50s and 60s and unlikely to keep increasing incomes for long, which means that revenue from income taxes could flatten in the next few years. Also, Lonski says, they are more likely to save for retirement than spend - and consumer spending is a big driver of the economy.

“The American consumer led us out of previous recessions with some semblance of gusto,” Lonski says. “They’re too old to do it now.”

US Foreclosure Levels On The Rise

Even though home sales data for both new and existing appeared a bit more optimistic - up 0.3% and 2.9% on a seasonally adjusted basis - those figures do not hold the whole truth. The level of homes on the market increased to a 10.2 months supply, which reflects the rising tide of distressed sales of foreclosures.

According the Mortgage Bankers Association’s most recent figures released Thursday May 28, 2009, approximately 5.4 million out of approximately 45.0 million home loans were delinquent or in some stage of the foreclosure process for 1Q09. This equates to 12.1% of all mortgages being delinquent or in the foreclosure process, compared to 11.93% at the end of FY08.

It is expected that the number of foreclosures should continue to expand as more individuals become unemployed or underemployed over the next year. Since the recession began over a year and a half ago, nearly 6 million have lost their jobs, with current estimates expecting the unemployment rate to broaden to 10.0% from the currently 8.9 % level.

Clearly the temporary moratorium on foreclosures imposed by lenders and mortgage underwriters, which have all but ended, did little to spur the mortgage note-holders to expedite the reworking of homeowners’ obligations. Unfortunately, as lending institutions are moving quickly against delinquent homeowners once again, more homeowners than ever before are falling behind on their mortgage payments and sliding into the foreclosure abyss as the U.S. housing crisis cancer continues to spread into what was previously known as the “stable borrower” ranks.

The addition of more real estate available for sale in an already saturated market should be expected to moderate housing prices even further. Based on the recently released data, prime based fixed-rate loan foreclosures have begun to overtake those of the risky subprime loans and rising adjustable-rate mortgages.

The foreclosure rate on these “plain-vanilla” mortgages has doubled in the last year, according to the Mortgage Bankers Association, and for the first time those loans make up the largest share of new foreclosures. During 1Q09, on a seasonally adjusted basis, 6.06% of all prime loans were delinquent, up from 5.06% in 4Q08.

The hardest-hit states with respect to delinquency rates remains the “fab four” states (California, Florida, Arizona and Nevada) which account for 46% of all new foreclosures nation.

This would leave us a bit concerned for those financial institutions that recently completed the “stress test” - including but not limited to Citigroup (C: 3.67 0.00 0.00%), Bank of America (BAC: 11.30 0.00 0.00%), Wells Fargo (WFC: 24.77 0.00 0.00%), US Bancorp (USB: 18.92 0.00 0.00%) and JPMorgan Chase (JPM: 36.65 0.00 0.00%). We are worried the government’s worst case scenario may not have been “worst” enough.

Oil Rally Supported By Inventory Drawdowns

The better-than-expected report from the Energy Information Administration (EIA) and the expected outcome of the OPEC meeting in Vienna is helping crude oil sustain its recent price momentum. However, given the commodity’s impressive recent gains, we would view pullbacks in the coming days as healthy for the rally’s long-term sustainability.

In terms of investments, we continue to advocate early-cycle leverage through oilfield service names, such as Weatherford (WFT: 20.13 0.00 0.00%) and Ensco (ESV: 37.64 0.00 0.00%). Our long-term favorites remain Exxon (XOM: 69.23 0.00 0.00%), Schlumberger (SLB: 56.35 0.00 0.00%) and Diamond Offshore (DO: 81.71 0.00 0.00%).

In its weekly status report Thursday, the Energy Information Administration (EIA) reported a greater-than-expected drawdown in crude oil inventories. The agency reported a drawdown of 5.4 million barrels from the preceding week. A major contributing factor to the heavy inventory drawdown was a greater-than-expected increase in refinery utilization to 85.1% from 82.3% in the preceding week.

Current crude oil stocks are 16.5% above the year-earlier level and remain above the upper limit of the average for this time of the year, as is shown in the chart below from the EIA. The supply cover dropped from the previous week to 25 days of supply, through it remains significantly above the year-earlier level of 20.7 days.

The drawdown in gasoline inventories was less than expected at 0.6 million barrels. However, current gasoline inventories, at 203.5 million barrels, are below year-earlier levels and remain below the lower-end of historical range, as shown in the next chart from the EIA. This is expected to help support further gains in gasoline prices in the coming days.

Offsetting gasoline’s tight supply fundamentals will be continued weak demand and increasing refinery utilization. The demand picture also remains very weak. Total refined products supplied over the last four-week period, a proxy for overall petroleum demand, was down 7.3% from the year-earlier period, with gasoline down 0.4%, distillates (includes diesel) down 9.9% and jet fuel down 9.1%.

Euro And British Pound Approach Key Retracement Prices Against US Dollar

A strong fundamental report drove the EUR/USD higher on Thursday. Following three days of lower-lows, the Euro came back with a vengeance as the European Commission’s gauge of economic sentiment posted stronger-than-expected results.

Shorts covered following the news as it somewhat diminished Wednesday’s comments from a European Central Bank member calling for the possibility of an interest rate cut to below 1%. Shorts were pricing in a rate cut on expectations of a worsening Euro Zone economy. Although today’s report still showed that consumer confidence was down, the improvement in the retail confidence index indicated that consumers are still willing to spend.

Technically, this market is at a critical juncture. Based on the longer-term charts, 1.4184 is still key 50% retracement resistance. Last week’s high at 1.4050 has also been flagged as a main top on the swing chart because of the four day decline. A failure to penetrate this area will indicate that the selling is greater than the buying at the current price levels.

The action over the past few days indicates how sensitive this market is to news. The recent violent swings in the market have for the most part been triggered by speculation. With the next ECB meeting coming up on June 4, traders will begin to look for more solid information to use in order to determine the direction of the ECB committee members.

Upside momentum is slowing down in the GBP/USD as buying has diminished near a key 50% retracement price at 1.6085. This price is critical to the structure of the current rally as it will dictate how much further this market could rally. If this market can establish support above 1.6085, then it has a great chance of continuing the rally to 1.6694.

Because of the size of the recent rally without any economic substance, traders have been reluctant to add to established positions at current levels. In addition, some traders do not seem too interested in initiating new positions at current levels until the market makes a correction.

Traders are also starting to become concerned about the strong surge in U.S. interest rates. Downside pressure could be building in the Pound on the thought that higher U.S. yields will attract foreign investors seeking a higher return. The problem is that higher yields could also raise concerns over the U.S. ability to fund its growing debt.

News that Japanese investors bought more foreign assets last month drove the USD/JPY sharply higher on Thursday. Declining global tensions and signs that the global recession may be bottoming fueled Japanese investor demand for higher yielding assets. This move should be welcome news for the Bank of Japan which has been looking for lower Yen prices in order to stimulate the export market.

Technically, the main trend turned to up on the swing chart when the market broke through the swing top at 96.69. The buying pressure landed this market inside of a major retracement zone at 96.79 to 97.49. Now that the news is out and the market has reached this retracement zone, long-side gains may be limited to the upside. Watch for profit-taking to begin especially if this market rallies all the way to 97.49.

US New Home Sales Flat - But “Flat” Is Better Than “Flattened”

New home sales in April were essentially flat with March, rising to a seasonally adjusted annual rate of 352,00, from 351,000, a rise of 0.3%. Given that the 90% confidence interval for these numbers is 14.5%, that is about as close to unchanged as you will get.

On a year-over-year basis, nationwide sales are down 34.0%. For the month, the Northeast and Midwest regions were unchanged, while a 1.9% increase in the huge South region offset a 3.8% decline in the West. On a year-over-year basis there is significant variation, with new home sales down 52.5% in the Northeast, but down just 25.4% in the South. The Midwest (-45.8%) and the West (-39.7%) fall in between.

As a result, the already small Northeast region has fallen to the point of being almost insignificant, accounting for only 5.4% of all new home sales. The South, on the other hand, accounted for 60.2% of sales. Keep in mind that the decline in new home sales has been going on for much longer than a year, so we are off 34.0% from an already low base a year ago.

This is the fourth straight April where new home sales have been sharply lower than the year-ago levels. The graph below (from http://www.calculatedriskblog.com/) is based on the not-seasonally-adjusted numbers, but tells the story nicely. It also points out that this year the traditional “spring selling season” has been a bit of a flop, despite record-low mortgage rates.

The best news in the report is the drop in inventories, which are down to 297,000, a drop of 4.2% from last month and down 35.4% from a year ago. This drove the months of supply down to 10.1 months from its peak of 12.4 months in January and 10.6 months in March. As the second graph (also from http://www.calculatedriskblog.com/) shows, this is encouraging, but not quite cause for celebration.

In this downturn we have seen the months of supply metric fall before, only to rise to new highs - and the level is still far above normal. During the housing-bubble years, four months was the norm, but over the longer term it appears that six months supply would be a fairly healthy market.  We are a long way from that point.

With interest rates backing up sharply, it appears that the bulk of the work to bring the months of supply back to more normal levels will have to come from further reductions in new housing starts. This is bad news for the homebuilders like D.R. Horton (DHI: 8.69 0.00 0.00%) and Lennar (LEN: 8.90 0.00 0.00%) as well as for the suppliers to the homebuilders, including lumber companies like Weyerhaeuser (WY: 33.39 0.00 0.00%) and roofing and insulation suppliers like Owens Corning (OC: 13.47 0.00 0.00%).

Overall however, we have seen worse new housing reports - “flat” is better than “flattened.” Stabilizing at a very low level is better than continuing to plunge. However, I do not see a real recovery in the cards anytime soon.

Four Easy Ways To Trade Gold With ETFs

Have you noticed? Gold is starting another run on the $1,000 mark. From April 17 through May 26, gold bullion jumped from $ 867.90 to $953.90 an ounce - a 10 percent gain in less than six weeks. Right now gold may be a little ahead of itself. But I suspect it will be challenging the all-time high of $1,032.70 hit on March 17, 2008, in the near future.

Ron Rowland

While it’s always been possible to participate in the gold market by purchasing mining company shares, until recently there were only two ways to get direct access to a rising gold market. One was to visit a dealer and buy physical gold, such as gold coins, and store it somewhere safe. The other was to trade futures and options on gold bullion.

You can still use these tools to invest in gold. But there are some potential drawbacks …

  • A thief could break into your house and find the gold you hid - and your homeowner’s insurance might not cover the loss.
  • The high leverage of futures trading is tempting but enormously risky. Read those account documents carefully. You are, quite literally, putting your entire net worth at risk with every trade.
  • And although options trading can be wildly profitable, your timing has to be nearly perfect.

Now, however, you have an additional, much simpler way to invest in gold: Exchange-traded funds, or ETFs, that are designed to track gold’s price. That’s right. You can get in on the gold market just as easily as you can buy a stock!

GLD: The First Gold ETF

State Street Global Advisors launched the first gold-based ETF in 2004. Now called SPDR Gold Shares (GLD: 94.24 0.00 0.00%), the fund has the easily-recalled ticker symbol GLD.

GLD was revolutionary. Structured as a trust, each share of GLD is equal to 1/10 of an ounce of gold. State Street had the shares listed on the New York Stock Exchange, and GLD turned into an instant success.

GLD shares represent ownership of gold in a secure, London vault.

Imitation is the sincerest form of flattery. And GLD didn’t have the market to itself for long. In 2005, iShares introduced a very similar product, the iShares COMEX Gold Trust (IAU: 94.258 0.00 0.00%), ticker symbol IAU. (If you remember high school chemistry, you know AU is the symbol for gold on the periodic table.)

There are some minor technical differences between these two ETFs. But GLD and IAU offer essentially the same thing: An easily-traded security that tracks the price of gold bullion almost perfectly.

As with other ETFs, GLD and IAU allow institutional investors to “create” and “redeem” shares in exchange for the underlying portfolio, which in this case is gold bullion. This creates an arbitrage opportunity. If the share price of GLD drifts too far above or below the actual gold price, professional traders push it back into line very quickly.

Which ETF should you consider buying? It’s really a personal preference. Both are huge and very liquid, though GLD is much larger than IAU. Just remember that every ten shares you buy gives you the equivalent of one ounce of gold. And you don’t have to store it under your bed.

Leveraged Gold!

I mentioned earlier that futures trading involves leverage and risk. I don’t recommend it for most people. However, if you want to use a little bit of leverage to trade gold, there are less-risky ways to do it …

PowerShares DB Gold Double Long ETN (DGP: 21.23 0.00 0.00%), launched in early 2008, is a quick and easy way to leverage gold’s price movements without the risk of a futures or an options account. DGP tracks an index of gold futures and is designed to return twice the change in the index.

Just as GLD drew competition from other ETF sponsors, DGP has a near-twin in ProShares Ultra Gold (UGL: 35.77 0.00 0.00%), which also moves two times the daily price change of gold bullion.

These leveraged funds are structured differently from normal ETFs. DGP is actually not an ETF. Instead it’s an ETN: An exchange-traded note. What’s the difference? Functionally speaking, ETFs and ETNs look very similar, but the actual structure is quite different …

An ETN is a debt obligation of a bank, in DGP’s case it’s Deutsche Bank. That means you’re taking credit risk when you buy an ETN. If Deutsche Bank should fail or go bankrupt, you could lose money even if gold goes up. (See my February 6, 2009, Money and Markets column to learn why ETNs may be riskier than they look.)

Meanwhile, UGL is a “commodity pool” rather than an “investment company” like most ETFs. ProShares uses gold futures to get the necessary leverage, but the pool structure insulates investors from margin calls.

Does this mean you should avoid DGP and UGL? No, not at all. It means that with the added leverage, they are different types of funds with different risk factors that you should consider.

Investing is all about risk. The smart thing is to know the risks and use them to your advantage. And when using leverage, understand that if the underlying index or the price of gold goes down, your fund’s share price can fall twice as fast.

DGP and UGL are both good ways to speculate in gold if you are in a position to watch the trade closely and can afford the added risks. But if you want more of a long-term core position in gold, GLD and IAU are probably better choices.

There you have it: Four easy ways to profit from gold with minimum hassle. You can buy GLD, IAU, DGP or UGL from any stock broker, either a traditional firm or an online discount brokerage.

Using Options To Control The Risks In Leveraged ETFs

Several readers noted that options on leveraged ETFs seemed like a recipe for disaster, as if no good could possibly come from piling leverage on top of leverage. While I certainly understand the sentiment, this type of thinking is typical of investors who have little or no experience in options. To the investor who is not versed in options, the options world often seems to be limited to an occasional covered call or an out-of-the-money call that is barely distinguishable from a lottery ticket - and seems to pay out just about as often.

In fact a large percentage of options traders are attracted to options because they are an excellent way to define, limit and manage risk. Yes, one can buy a put to provide protection for a long stock protection, but in the absence of owning the underlying (be it as stock, ETF, index or whatever), options traders are particularly fond of creating multi-leg options positions where the downside risk is know at the beginning of the trade and does not waver as long as the position is maintained.

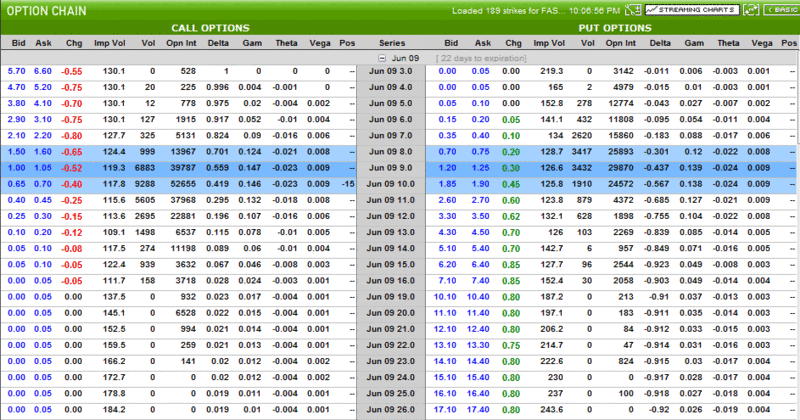
Getting back to leveraged ETF, I have reproduced a portion of the options chain for FAS, perhaps the most notorious of the Direxion triple ETFs, in the table below. With a current mean implied volatility of 126, Direxion Financial Bull 3X Shares ETF (FAS: 9.47 0.00 0.00%) is a highly volatile ETF. FAS is so volatile that even with only 17 trading days remaining in the June calls, it is possible to sell the June 15 calls, which are 70% out of the money, for 0.05. The June 11 calls, which are 24.4% out of the money, can be sold for 0.40.

In terms of risk management, let’s say that an investor does not believe that FAS is going to rise more than 24% in the next 3 ½ weeks, so he or she decides to sell the June 11 calls, but hedge that position by buying an equal amount of the June 13 calls at 0.15. This is a bear call spread and will net $25 for each option contract, with a maximum loss of $175 per contract (not including commissions). The trade makes money if FAS expires at 11.25 or less, which means that the position can absorb up to a 27.2% gain in FAS. The trade offers odds of 7-1 ($175 to $25) and the maximum risk is defined up front and cannot change during the life of the trade.

This is but one example of how options can limit the risk of trading triple ETFs. There are many other potential examples.

The bottom line is that options trades can be structured in such a manner that they are much less risky than stock trades, even if the options are on volatile securities such as triple ETFs.

Use Trailing Stops If You Are Participating In This Stock Market Rally

While I’ve been lucky enough to identify and forecast a strong rally in global stocks since March, I have made it clear to readers that I don’t think this is anything more than a rally within a bear market.

The higher this rally goes, however, the more you will be hearing that a new bull market has started. But I would not be fooled.

Why do I believe we are simply in a “bear market rally”? I believe this is so because all great starts of bull markets (like the ones in 1949 and 1982) had certain important things in common. In one phrase, these things can be summed up with the words “Great Values.”

When the bull markets started, companies had to offer great dividend yields to investors to entice them to invest. The dividend yield on entire indices was very high.

Second, the price-to-earnings ratio on most stocks, as well as entire indices was very low. Today, I want to focus on the dividend aspect of this idea… and to show you a chart I think every investor should copy, print out, and memorize.

You see, the great thing about a dividend is that is cannot be faked.

Either the check goes out or it does not. Either the company pays a dividend on its stock - a clear and certain dividend - or it does not. Tracking the dividend yield on either a single stock on an entire index is one of the best ways to gauge if stocks are selling at great values.

We have seen time and again that when dividends rise to a certain level, stocks become great bargains and bull markets begin. So let us turn our attention to the chart below. This is the S&P 500 Index (^GSPC: 906.83 0.00 0.00%) and the dividend yield on it, going back to 1928.
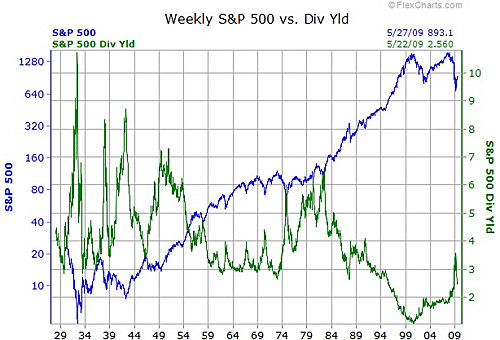
From the start of the chart, you see the horrific loss in value of the S&P (in blue) from 1929 to 1932. The index lost over 90% of its value by the time it reached its lows in July 1932. Nearly three years of the most vicious bear market in history had nearly wiped out stockholders, and made almost no one even think of buying stocks.

At this very time, the absolute lows, some companies were still making money, and they were still paying out dividends. The yields they paid out (in green), as a percentage, grew to be huge. In July 1932, the yield on the S&P reached 10.5%. These double-digit yields were never to be seen since.

However, this proved to be the low of the market. In the next five years, the S&P soared hundreds of percent from that low, the low that was signified by huge yields. You can see the huge move from mid-1932 to 1937. In terms of the dividend yield, it plunged back to the 3% level.

The bull market that began the real post-depression recovery was born in June 1949. The price levels of both the Dow (^DJI: 8403.80 +103.78 +1.25%) and the S&P were about where they’d been 20 years prior. It was very nearly a lost two decades for stocks. Wall Street during that summer of 1949 was a sleepy place. Few new faces wanted in on an area smart young people considered a dead end.

And yet look where the dividend yield was when that huge bull market began in June 1949. It was 7.6%. From 1949 to 1966 - 17 years - a great bull market was underway. It took the S&P from 17 to over 80.

By January 1973, the dividend yield on the S&P had fallen to a then-record low of under 3%. This low yield was definitely not signaling that stocks were at great values. And the action of the next two years proved this. Stocks fell by nearly half. The S&P plunged from over 120 in January 1973 to just 62 by October of the next year.

And what was the yield doing? It soared back to near 6% toward the end of 1974.

To sharp observers like Richard Russell, these high yields, coupled with very low P/E ratios, were the sign of a great buying opportunity. He had stayed out of the market after 1966, spending the next nine years in T-bills and gold stocks (gold itself was still illegal for Americans to own.) When (around Christmas of 1974) he said we could see a great buying opportunity many people were angry at him. I confess to being one of them. At the time, I was a 19-year-old know-it-all who was convinced that Russell was wrong about everything. It turned out I was wrong, and I have never since forgotten that lesson. Russell’s stock picks often paid around 10% dividends and as 1975 went on, they also rose in price.

By August 1982, the Dow, which had reached nearly 1,000 back in 1966, was just 776, over 16 long years later. But what was the dividend yield saying in 1982? Were stocks finally great values again? The dividend yield on the Dow had gotten back up to over 5%, and the yield on the S&P went to over 6%.

Now, in those days, that still seemed small compared to the double-digit yields you could just get by holding T-bills, so it didn’t seem so tempting. And yet, from the benefit of hindsight, we see that those levels of dividend yields were plenty high enough to mark the beginning of what would be the longest bull market in history. In the 25 years from 1982 to 2007, the Dow soared from 776 to 14,165: 1,725%. The S&P soared from 102 to 1,565: 1,434%.

By 2000, I had learned my lessons from the 1970s. I saw the dividend yield fall to around 1%, a low it had never before seen. When I pointed this out, people brushed it off.

We all know what has happened to stock prices since. They may have gotten over their early 2000 peaks again in 2007, but this was just a brief new high. In essence, by March 2009, the average stock index had gone nowhere since 1997. Another lost decade.

But in March - just a few weeks ago - a rally began. What was the dividend yield on the S&P when this rally began? Just 3.58%. In the few weeks since the March 9 lows, yields have fallen sharply and are at this writing a mere 2.46%.

I ask you again to look back at the sweep of the stock chart over the past 80 years. At every start of a real bull market, dividend yields were much, much higher than just 3%. They were over 6% in 1982, over 7% in 1949, and over 10% in 1932. Those were the beginnings of real bull markets. The kind of markets that if you got in early and just held, and reinvested your great dividends, they made you rich.

And that is why I have urged that everyone who participates in this rally use trailing stops. These stops can be staggered: some as low as 3%, others as high as 50%, and every gradation in between.

Yes, if the Dow reaches 10,000 or 12,500, or the S&P goes back to 1,000, or 1,100 or 1,200… there will be great rejoicing and optimism that the worst is over. But I will be looking at both the dividend yield and the price-to-earnings ratio on both indices. And from where I sit, if stocks do indeed go that high, it will only be a signal to tighten my stops.

Bull markets begin with stocks trading at great values. And those values are not yet here.
What Banks’ Practices Mean For Financial ETFs

The financial sector, along with exchange traded funds (ETFs), are being boosted by what may seem to be a financial legerdemain.

There are many complicated rules in the banking and finance industry, and one such rule, the purchase accounting rule, is able to make bank earnings look better than they otherwise would, says Jeremy Hobson for Marketplace. This is going make discussions about how these financial institutions should be regulated tough.

For example, federal regulators seized Washington Mutual when it failed and sold it to JP Morgan (JPM: 36.65 0.00 0.00%) for around $2 billion. JP Morgan used an accounting rule to mark down the loans on WaMu’s balance sheets upon purchasing the institution, and JP Morgan would eventually mark up those loans when the market is doing better. Wells Fargo (WFC: 24.77 0.00 0.00%) also did the same thing with Wachovia’s assets and PNC Financial Services (PNC: 43.66 0.00 0.00%) did it with National City.

But we should scrutinize these business models carefully because we as outside investors don’t have access to the detailed information that auditors would. So we should look to auditors to keep the shareholders informed about whether financial institutions are reporting good earnings or a trick in accounting.

  • Financial Select Sector SPDR (XLF: 12.01 0.00 0.00%): down 2.9% year-to-date; JPM is 13.2%; WFC is 8%

ETF XLF

Consolidated Banking, Maybe?

Clearly the cobbled-together oversight from various federal agencies was ineffective to contain the current financial crisis that all but swallowed the U.S. last year — institutions such as but not limited to Citigroup (C: 3.67 0.00 0.00%), Bank of America (BAC: 11.30 0.00 0.00%), JPMorgan Chase (JPM: 36.65 0.00 0.00%) and AIG (AIG: 1.67 0.00 0.00%) — and it remains in fairly close proximity to do so again.

Several weeks ago, U.S. Treasury Secretary Timothy Geithner sent to Congress a proposal to potentially to overall the current supervision of financial markets. While much is still up in the air, it is now expected as early as mid-June 2009 that the Obama Administration will make a formal recommendation to Congress for the creation of a single banking regulator to oversee the entire sector. It would be hoped that if such a proposal were sent to Congress it woud be finalized by the end of the year to help resolve the current quagmire.

Currently, a disconnected grouping of state and federal regulators oversee financial institutions throughout the country. It is not anticipated that the Obama Administration will propose the elimination of this so-called “Dual Banking System.”

The new regulator would serve as primary regulator for the nationally chartered banks and thrifts, serve as a secondary oversight for the more than 5,000 state-regulated banks and the primary regulator for the nationally chartered banks and thrifts, and help to streamline supervision of banks and make it harder for banks to game the system by shopping for the lightest form of oversight.

If passed, the new banking regulatory agency would potentially consolidate the Office of the Comptroller of the Currency and the Office of Thrift Supervision, and take over the supervisory powers from the Federal Reserve and the Federal Deposit Insurance Corp (FDIC), with the Federal Reserve to focus its efforts on overseeing systemic economy risks and FDIC the ability to take large financial companies that aren’t banks into receivership.

Unfortunately, it appears that there is little clarity with respect to the handling the potential jurisdictional fight from a merger of the Securities and Exchange Commission and the Commodity Futures Trading Commission.

It is also unclear how willing Congress would be to go along with the dramatic departure from the norm that the administration is expected to request in the coming weeks. And it appears that each of the banking agencies have prepared for trench warfare in recent weeks — many of the details may ultimately be left up to Congress.

Buy And Hold Is Alive And Well

Every time the United States goes through a recession, the pundits all race to be the first to proclaim that “Buy and Hold” is dead.  I can’t watch a financial news channel or read a financial website without some mention of this proclamation.  Well I’m growing tired of it, and if it were up to me, I’d prohibit anyone else from making this point for the rest of 2009.

Buy and Hold is not dead, and I’m on a mission to prove it.  Buy and Hold has worked brilliantly for decades, and it will continue to do so in the future.  The stock you bought in 2007 is worth less now than what you bought it for?  Oh boohoo, go cry me a river…somewhere else.  The economy has peaks and troughs, and we’re in the middle of one of the more serious troughs since the Great Depression.

Buy and Hold has worked wonders for Warren Buffett for years.

The pundits will claim that you can’t buy a stock in year X, leave it alone, and sell it many years later in year Y for a profit.  These people cherry pick companies to make their points.  They find the few companies in the US economy that have failed so miserably that you’d think they were run by the very same people who run the Social Security Administration.  General Motors is a favorite, along with General Electric (which is a misnomer, as we’ll prove below).

To prove that Buy and Hold is not dead, I logged onto Yahoo! Finance and randomly selected 35 components of the S&P 500.  I reviewed these companies’ 20-year returns from May 21, 1989 through May 21, 2009.  I selected the following companies:

Vulcan Materials (VMC: 42.01 0.00 0.00%), Applied Materials (AMAT: 11.30 0.00 0.00%), General Electric (GE: 13.19 0.00 0.00%), Reynolds American (RAI: 40.25 0.00 0.00%), Deere & Co. (DE: 41.85 0.00 0.00%), Freeport McMoran (FCX: 52.20 0.00 0.00%), Zion’s Bancorp (ZION: 13.74 0.00 0.00%), Home Depot (HD: 22.70 0.00 0.00%), Coca-Cola (KO: 46.90 0.00 0.00%), Halliburton (HAL: 22.77 0.00 0.00%), Alcoa (AA: 9.09 0.00 0.00%), Apple (AAPL: 135.07 0.00 0.00%), Microsoft (MSFT: 20.45 0.00 0.00%), Archer Daniels Midland (ADM: 27.19 0.00 0.00%), Pepsi Bottling Group (PBG: 32.09 0.00 0.00%), Johnson & Johnson (JNJ: 54.53 0.00 0.00%), Consolidated Edison (ED: 35.41 0.00 0.00%), Oracle (ORCL: 19.21 0.00 0.00%), Target (TGT: 39.14 0.00 0.00%), AT&T (T: 24.63 0.00 0.00%), IBM (IBM: 104.69 0.00 0.00%), Wal Mart (WMT: 49.55 0.00 0.00%), Pfizer (PFE: 14.69 0.00 0.00%), Boeing (BA: 44.32 0.00 0.00%), Goldman Sachs (GS: 144.65 0.00 0.00%), Union Pacific (UNP: 45.56 0.00 0.00%), Qualcomm (QCOM: 42.95 0.00 0.00%), Conagra Foods (CAG: 18.36 0.00 0.00%), Schwab (SCHW: 17.15 0.00 0.00%), Gannett (GCI: 4.96 0.00 0.00%), Newmont Mining (NEM: 47.35 0.00 0.00%), Loews (L: 26.31 0.00 0.00%), NVR (NVR: 480.50 0.00 0.00%), Bank of America (BAC: 11.30 0.00 0.00%), and United Tech (UTX: 52.38 0.00 0.00%).

Before continuing, go ahead and guess how many of these companies currently trade lower than they did in 1989.  Five?  Ten?  Fifteen?  Nope, wrong!

Of our sample of 35 companies, only one finished lower over this 20-year period, Gannett.  Gannett was off nearly 50% from its 5/21/89 price.  Compare this to several companies like Microsoft and Oracle which were up approximately 5,000% over the same period.  Even General Electric’s stock price increased since 1989 by a whopping 403%.

This sample is less than 10% of the overall population, but I believe that others would find similar results if running the same random sampling techniques.  Very few companies have seen losses over a 20-year period.

After running this analysis, I still wasn’t happy, so I pulled ten of these stocks (including Gannett) into one portfolio (each at 10%) and reviewed how the portfolio would perform over the same period.   I chose Microsoft, United Tech, ConEdison, General Electric, IBM, Conagra, Gannett, Loews, Schwab, and Bank of America.  Creating this portfolio in 1989 and leaving it alone until 2009 would have yielded 403%, compared to the S&P 500 return of 177%.

403% is an outlier, and we’d expect a combination of this and other analyses to bring the average to the historical return of the S&P 500, but this analysis is sufficient to prove our point that buying and holding a diversified portfolio of 10-15 stocks within different industries will provide long-term investors with a comfortable investment.

I’d like to stress that it would take a diversified portfolio to achieve these results.  Buying and holding one or two stocks leaves you open to substantial and reckless risk.

This takes us to our next point. The average American doesn’t need to get bogged down by spending hours upon hours deciding which 10-15 stocks to hold, and whether they’re all in different industries.  Simply investing in a few well diversified mutual funds or exchange traded funds (ETFs), especially those that track a well-known index, will provide the average investor with a solid long-term return.

It’s not very difficult to Buy and Hold and make money, but these pundits write and talk on newspapers and TV shows about the death of Buy and Hold in such a frightening manner that regular investors panic and abandon this strategy.  These investors then either attempt to time the market with little knowledge of how markets work, or simply avoid the market altogether and invest their money in 2.00% CDs for the rest of their lives.  This is a big mistake, since there hasn’t been a single 30-year period where the S&P 500 has lost value.

If you’re reading this and aren’t sure where to put your money, stick it in a few low cost mutual funds or ETFs that track major indices like the S&P 500, Russell 2000, or MSCI Emerging Markets Index and leave it alone.  If you have a little more interest in the market, go ahead and piece together that diversified stock portfolio.  These pundits are wrong.  Buying and holding is alive and well, and as long as the US and world economies continue to grow, you’ll see your portfolio grow along with them.

U.S. Dollar, the Worst Investment of All Time?

One investment, more than any other, has proven to be a terrible storehouse of value for well over 80 years.

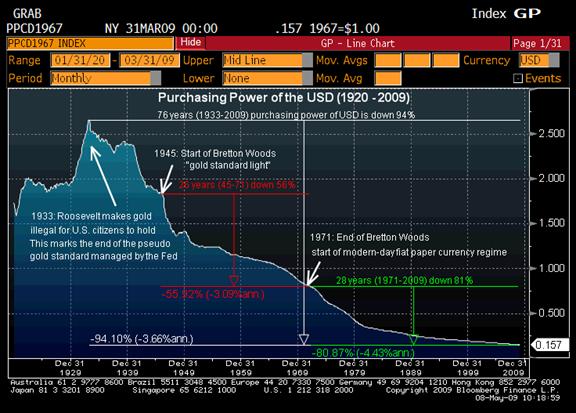
While some disasters unfold rapidly (Enron, subprime mortgages, etc.), this investment’s decline has occurred in slow motion, losing an average of 3.6% a year. Indeed, you can hardly find a period in the last 89 years in which this investment actually MADE money.

That investment is the dollar.

purchasing power.gif

The above chart shows the history of the dollar’s purchasing power going back to the 1920s. All told the dollar has lost 94% of its purchasing power since we abandoned the gold standard. The most dramatic loss in purchasing power occurred directly after Roosevelt made it illegal to own gold. However, with few exceptions, the dollar has been spiraling downward ever since 1920.

After Nixon ended Bretton Woods (legislation that pegged the dollar to gold indirectly), the pace of purchasing power destruction accelerated with the dollar losing an average of 4.4% in purchasing power annually.

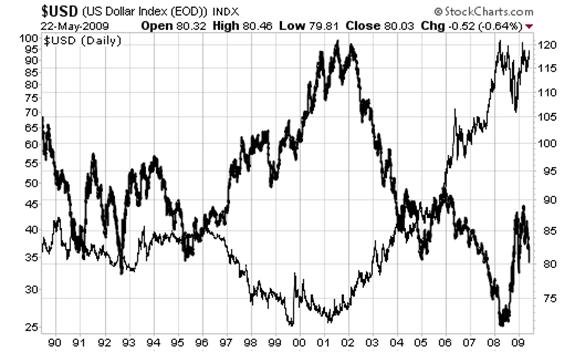
Gold and the Dollar have maintained an inverse relationship ever since this time. One zigs, the other zags. One rallies, the other falls. And starting in 2000, both entered long-term trends: the dollar falling while gold rallied (see the below chart).

Now, nothing ever goes straight up OR straight down. And starting in June 2008, the dollar erupted in its strongest rally in decades, jumping 22% in eight months. The story here was easy to understand, although most of the media ignored it. With the dollar continually in decline and interest rates well below the rate of inflation in the post-Tech Crash, foreign corporations and institutional investors borrowed heavily in dollars.

Doing this meant their debts were continually shrinking relative to their profits (sales were denominated in a currency that was rising relative to the currency in which their debts were denominated). This means their debts were easier to pay off.

However, when the dollar started a rally in July ’08, this positioning began going horribly wrong. Anyone short the dollar got killed and had to cover their shorts (buy dollars) which in turn pushed the dollar higher. At one point there were an estimated $9 trillion in dollar shorts in the world. So the dollar rally was the mother of all short squeezes. And as you can see, it kicked gold in the teeth.

However, with the Feds running the printing presses and inflationary concerns hitting the market (oil and most industrial commodities have soared in the last three months), the dollar’s rise may have come to an end. If the dollar breaks below 79 in a meaningful way, it’s “look out below” time. Which should put gold above $1,000 in a sustainable way.

We wrote last week that based on the historic trends in the last gold bull market (1970-80) we expected gold to begin its next leg up this fall. However, looking at the dollar vs. gold chart above, it may already be happening. Watch these two investments closely. We may be on the verge of a truly seismic shift between the gold and the dollar.

Good Investing!

Crude Oil and the US Dollar Elliott Wave Analysis

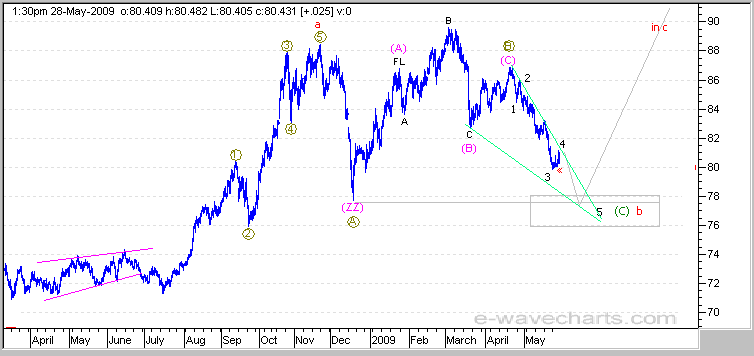
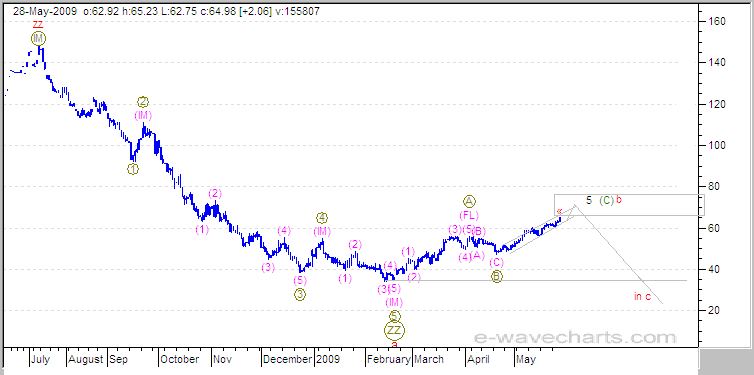
The USD is in wave b down, currently in wave 5 of (C). We should see further downside before a strong rally in wave c up. Crude is in wave b up, currently in wave 5 of (C). Crude is an excellent example of a bear market correction, since we would want to see at least 3 waves (an abc) complete from the peak. If you are not familiar with Elliott Wave, you can examine the completed decline on any chart that has had a parabolic advance in a so called bubble. The decline completes as 3 waves, with wave b up, as the bear market rally. This rally also coincides with the other markets.

The charts are aligning for a reversal similar to last July before the commodities and markets crashed. Its deja vu before history repeats itself. We still need to see further upside for the DOW, but the next decline should take out the March lows. We still need to see the USD and Euro (not shown) hit their targets before the reversal. The metals still have further upside as well, but we should see a strong correction similar to the one last year, before the bull advance resumes. Many of our charts illustrate triangles or ending diagonals patterns, which indicates a top is near and we could see a reversal as early as next week. The reversal could extend a bit longer, so keep an eye on the USD, when it hits the target and bounces above the top trendline, we expect all of the markets to roll over at the same time.

USD

Crude Oil


We have been extremely busy and it has almost been almost a year since our last free newsletter. The last newsletter covered the USD and Crude as well and also mentioned the forecast for the pending decline in the markets and commodities that occurred in July 2008. We called the top for Crude on the day that it rolled over, with the first downside target of $55.

Since the decline in the markets, we have been too busy to distribute the free newsletters, but I wanted to get this one out, so that you would be aware of the current market condition. Be careful, it is a bear market rally and its close to completing.

These charts are only a guide so that you can follow the action and watch the expected action. The action could play out exactly as illustrated or it may need minor adjustments as we follow it through.

If you are interested in viewing these updated charts and other detailed charts with targets on a daily basis, please see the registration details below.

Financials XLF ETF Coiled Pattern About to Break in Which Direction?

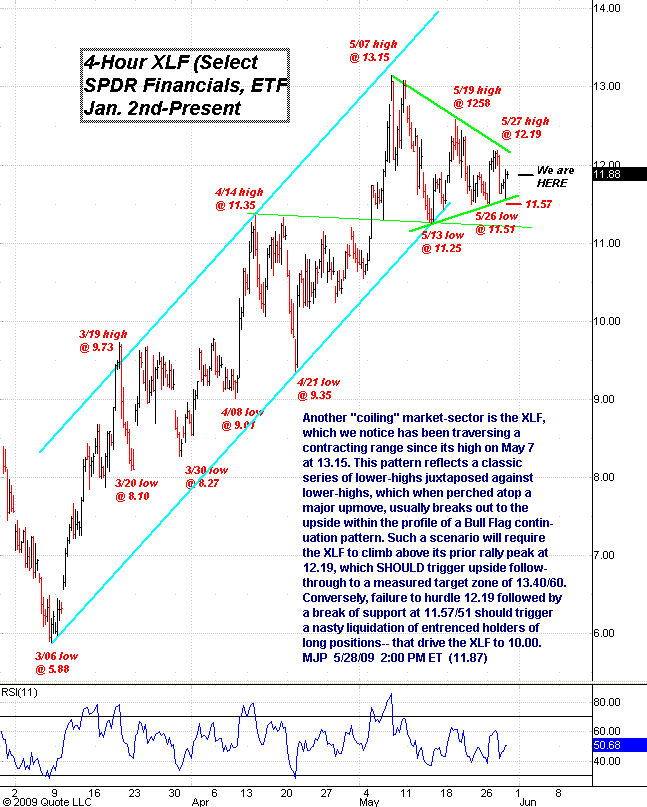
I scan the various sector charts to see if any of them provide clues about the eventual directional breakout of the major equity market ETFs from "The May Coil" pattern.  One “coiling” market is the Financial Select SPDR ETF (NYSE:  XLF), which has been traversing a contracting range since its high on May 7 at 13.15.  This pattern reflects a classic series of lower highs juxtaposed against higher lows, which when perched atop a major upmove usually breaks out to the upside within the profile of a bull flag continuation pattern. 

Such a scenario will require the XLF to climb above its prior rally peak at 12.19, which should trigger upside follow-through to a measured target zone of 13.40/60.  Conversely, failure to hurdle 12.19  followed by a break of support at 11.57/51 should trigger a nasty liquidation of entrenched holders of long positions – that drive the XLF to 10.00.