imgadp

Top-Hot-Stocks

Hot Article ------ Favorites this page

2009-08-24

In The Race For A U.S. Economic Rebound, Growing Debt And Budget Deficits Remain The Biggest Possible Roadblock

Even as investors get more and more bullish about the outlook for the U.S. economy, the economy’s underlying foundation continues to erode.
In a report to be released this week, the Obama administration will boost its 10-year projectiojn for the federal budget deficit to about $9 trillion - an increase of roughly $2 billion, or 29%, from its prior projection, Fox News reported over the weekend, citing a source from the Office of Management and Budget (OMB).

The new cumulative deficit projection - for 2010-2019 - replaces the administration’s previous estimate of $7.108 trillion. Changes in budget projections - whether they result in a surplus or a deficit - are often refined as economic conditions change. This new projection was necessary because the recession has gone on for so long, causing federal tax receipts to plunge - and because the economic rebound will be prolonged and weak, resulting in lower forecasts for future federal revenue.

Although most of the news media focuses on the Obama administration’s $787 stimulus measure, the fact is that the federal government was pushing forward with nearly $12 trillion in rebound-related financing commitments, Money Morning reported this spring.

The administration earlier this year predicted that unemployment would peak at about 9% without the financial-jump-starting initiatives and 8% with them. But U.S. joblessness zoomed skyward anyway, and stood at 9.4% last month, although many economists now say that a double-digit unemployment rate - one of 10% or more - is easily possible.

The nation’s debt now stands at $11.7 trillion. In the scheme of things, that’s more important than talking about the deficit, which only looks at a one-year slice of bookkeeping and ignores previous debt that is still outstanding.

Back in June, the non-partisan Congressional Budget Office (CBO) predicted that the federal deficit would reach $1.825 trillion this year. The CBO and the Obama administration will tomorrow (Tuesday) separately release new budget-deficit predictions. Last Wednesday, a senior White House official, speaking on the condition of anonymity, told The Associated Press that the administration estimate would reach $1.58 trillion - or triple last year’s deficit.

The report for the budget year that ends Sept. 30 also will predict Washington to spend $3.653 trillion this year, although revenue will reach only $2.074 trillion, the unnamed senior official told The AP.

“Whether it’s $1.6 trillion or $1.8 trillion, it’s pretty bad,” said Robert Bixby, executive director of the bipartisan fiscal watchdog The Concord Coalition, told Fox News. “I hope no one tries to spin that as good news.”

Total U.S. debt has soared to $11.7 trillion (the budget deficit is the “shortfall” in the annual deficit, while the debt is cumulative), having balloned to that level as a result of the multiple annual deficits that have become the norm, it seems.

Market Matters

Just who is the world’s great economic superpower these days?  At times, it seems, “as China goes, so go the world equity markets.”  Early in the week, the Shanghai Composite Index (SSE) suffered its largest percentage decline since late 2008, with the index plunging more than 20% for the month on concerns about the sustainability of China’s recovery.

The global markets watched as the Japan, Europe, and the U.S. indexes followed the SSE downward.  By mid-week, however, all eyes were back on the domestic market as another sell-off in China was overshadowed by signs of growing U.S. economic strength and reports of enhanced energy demand.

The global bailout plans moved into a new stage as the Swiss government relinquished its control over banking giant UBS AG (UBS: 17.44 -0.10 -0.57%) by selling off its investment for a $1.13 billion profit, or a 30% annualized return.  While the U.S. government has yet to reap similar benefits, several major banks have paid off their Troubled Asset Relief Program (TARP) loans and the CEO for one of the poster children for financial distress, American International Group Inc. (AIG: 34.34 +1.49 +4.54%), announced that his firm should be able to pay back the government and may even be able to “do something for shareholders as well.”

While many auto dealers complained about the rebate process on the “Cash for Clunkers” program, General Motors Corp. stepped forward and will begin providing advances to participants who continue to wait for the government to move through its traditional red-tape.

The healthcare debate (and political infighting) raged on (complete with widespread town hall civil disobedience).  Rumors that the government would remove its public-health-plan option sent related health-care stocks soaring early in the week, though the jury remains out as to how this will really play after U.S. President Barack Obama guaranteed approval of an overhaul and then bashed congressional Republicans for their efforts in blocking any plan whatsoever.

On the earnings front, the housing sector received mixed signals as Home Depot Inc. (HD: 27.419 -0.081 -0.29%) bested expectations, while rival Lowe Companies Inc. (LOW: 21.17 +0.01 +0.05%) fell short and reduced its outlook. Cost-cutting was widespread among retailers as The TJX Cos. Inc. (TJX: 35.95 +0.09 +0.25%), The Gap Inc. (GPS: 19.29 -0.19 -0.98%), and even Target Corp. (TGT: 45.56 -0.10 -0.22%) benefited from increased margins, though sales remained lackluster at best.

Hewlett-Packard Co. (HPQ: 44.98 +0.20 +0.45%) struggled in its PC and printer-business segments, though management expects a healthy rebound in its fiscal fourth quarter.

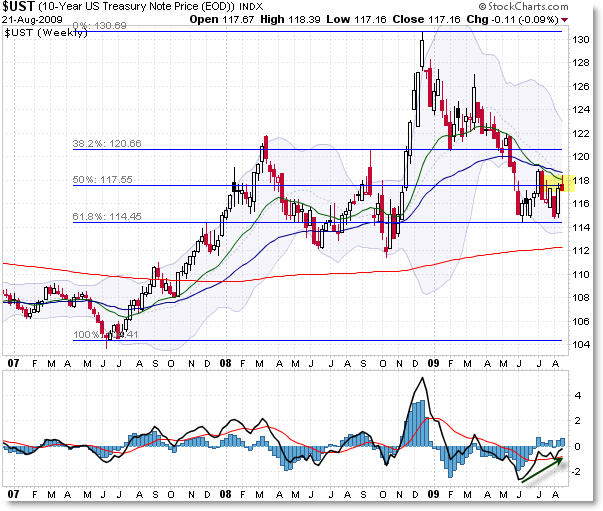
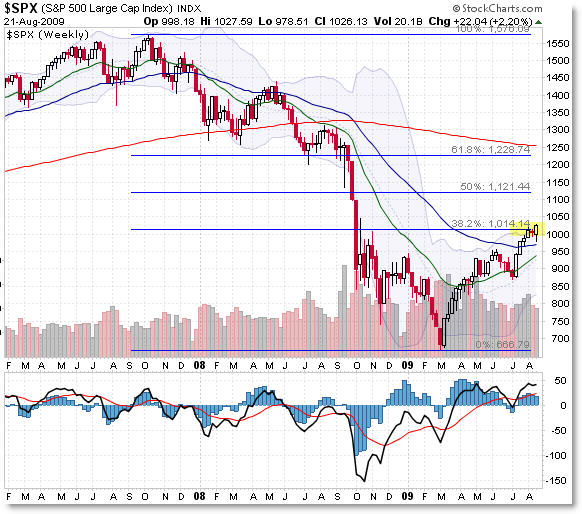
Fixed income benefited from some early “flight-to-quality” trades and a report that showed strong foreign demand for U.S. Treasuries in June (despite ongoing rumors to the contrary).  Stocks fell sharply in sympathy with the China sell-off, though buyers reemerged in a big way on positive signs from the earnings and economic reports.

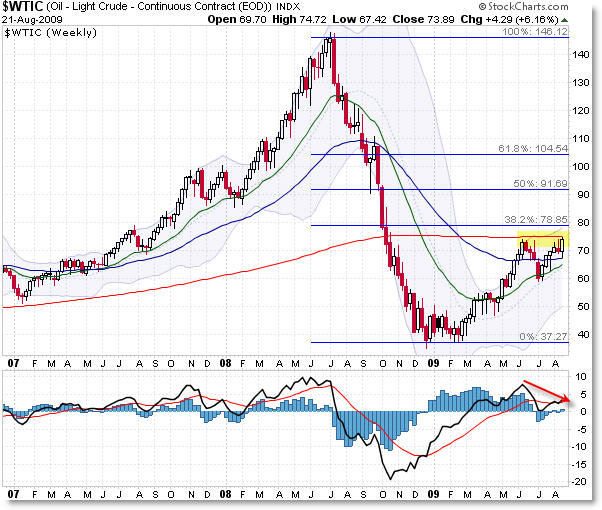
Likewise, oil prices shook off some early week negativity and surged to 2009 highs, as a surprising plunge in inventory levels revealed growing demand - perhaps to coincide with the beginning of a global economic rebound?  On that note, U.S. Federal Reserve Chairman Ben S. Bernanke’s comments about the prospects for recovery (though slow at first) were extremely well-received as investors seemed to all but forget about following Shanghai and the U.S. markets assumed the leadership role once again.  The major domestic indexes shrugged off the weak start and pushed to new highs for the year.

Market/ Index

Year Close (2008)

Qtr Close (06/30/09)

Previous Week
(08/14/09)

Current Week
(08/21/09)

YTD Change

Dow Jones Industrial

8,776.39

8,447.00

9,321.40

9,505.96

+8.31%

NASDAQ

1,577.03

1,835.04

1,985.52

2,020.90

+28.15%

S&P 500

903.25

919.32

1,004.09

1,026.13

+13.60%

Russell 2000

499.45

508.28

563.90

581.51

+16.43%

Global Dow

1526.21

1,629.31

1,803.83

1,819.50

+19.22%

Fed Funds

0.25%

0.25%

0.25%

0.25%

0 bps

10 yr Treasury (Yield)

2.24%

3.52%

3.56%

3.56%

+132 bps

Economically Speaking

In addition to the Home Depot and Lowe’s earnings reports, housing news was prevalent during the week and the results were somewhat confusing.  The National Association of Home Builders reported that its Housing Market Index climbed for the second month in a row and reached its highest level in over a year.  Likewise, applications for mortgages increased for the third straight month on declining interest rates.

However, foreclosure rates remain on the rise and, according to the Mortgage Bankers Association, 13.2% of mortgages are delinquent or worse (in foreclosure); in fact, subprime mortgages are no longer the only area of concern as the unsettled labor picture has prompted homeowners with strong credit to fall behind on their prime mortgages as well.

Though housing starts fell in July, the decline was entirely attributable to apartment activity and construction of single-family homes actually rose for the fifth straight month.  Additionally, existing home sales in July surged by more than 7% as buyers took advantage of the misfortunes of others (in foreclosure), though prices continue to fall because of transactions related to these distressed properties.

In non-housing news, separate regional reports from the New York and Philadelphia Feds boosted the outlook for the domestic manufacturing sector and the overall economy.  Wholesale inflation remained benign as the producer price index (PPI) fell by a wider-than-expected 0.9% in July and prices have plummeted over the past 12 months by the largest percentage (6.8%) since records have been kept, dating back to 1947.

Be forewarned: Oil just hit a 2009-high.

U.S. Federal Reserve policymakers met for their annual conference and Fed Chair Bernanke shared a favorable assessment about the recovery process from “the most severe financial crisis since the Great Depression.”  Of course, Bernanke tempered some of his remarks and reiterated that, while the recession seems to be coming to an end, the rebound would likely be slow, with unemployment remaining a concern.

Bernanke also spoke of the need for financial regulatory reform in order to ensure the current financial debacle isn’t repeated.  The Fed also extended its Term Asset-Backed Securities Loan Facility (TALF) lending program in order to help stem the potential “challenges” that remain among commercial mortgage-backed securities.

Weekly Economic Calendar

Date Release Comments
August 18 Housing Starts (07/09) Single-family starts up, though apartments dropped
PPI (07/09) Much larger than expected decline in wholesale prices
August 20 Initial Jobless Claims (08/15) Surprising rise in claims for unemployment benefits
Leading Indicators (07/09) 4th consecutive monthly increase
August 21 Existing Homes Sales (07/09) Best showing in almost 2 years
The Week Ahead
August 25 Durable Goods Orders (07/09)
Consumer Confidence (08/09)
August 26 New Home Sales (07/09)
August 27 Initial Jobless Claims (08/15)
August 28 Personal Spending/Income (07/09)
a

US Earnings Preview For This Week

Dell (DELL: 14.96 +0.47 +3.24%) will release its results on Thursday, after the close, as second-quarter earnings season nears an end. The technology company is projected to have earned 23 cents per share.

Joining Dell will be fellow S&P 500 members Big Lots (BIG: 24.03 +0.22 +0.92%), Medtronic (MDT: 37.685 -0.115 -0.30%), Novell (NOVL: 4.77 +0.08 +1.71%), Staples (SPLS: 22.67 +0.18 +0.80%) and Tiffany & Co. (TIF: 32.37 +0.27 +0.84%). A total of 76 companies are confirmed to release results.

Given the surprisingly strong July existing home sales report, all eyes will be on Wednesday’s new home sales report. Specifically, economists will want to see that new home sales also rose for a fourth consecutive month.

  • Tuesday: August Conference Board consumer confidence, June S&P/Case-Shiller Home Price Index
  • Wednesday: July durable goods orders, July new home sales, weekly crude inventories
  • Thursday: Preliminary second-quarter GDP, weekly initial jobless claims
  • Friday: July personal income and spending, revised August University of Michigan consumer confidence

Atlanta Federal Reserve Bank President Dennis Lockhart will talk to the Chattanooga Area Chamber of Commerce on Wednesday. On Thursday, St. Louis Federal Reserve Bank President James Bullard will speak to MBA students at the University of Arkansas.

The markets are clearly climbing the wall of worry. Though the tailwind from second-quarter earnings has weakened, the markets are still finding upward momentum. At the same time, oil is hitting new highs. It’s difficult to make an argument for fighting the trend, though I do worry about how long this rally can last.

Companies That Could Issue Positive Earnings Surprises

Same-store sales for Dollar Tree, Inc. (DLTR: 45.66 -0.38 -0.83%) surged by 6.8% last month. In response, the majority of the covering brokerage analysts raised their second-quarter profit forecasts, pushing the Zacks Consensus Estimate up 3 cents to 54 cents per share. Given that DLTR has topped expectations for 7 consecutive quarters, another positive surprise could be forthcoming. Dollar Tree is scheduled to report on Wednesday, Aug 26, before the start of trading,

Marvell Technology Group (MRVL: 14.36 +0.13 +0.91%) has topped expectations over the last 4 quarters by an average margin of 3 cents per share. Ahead of the company’s fiscal second-quarter results, 2 of the covering brokerage analysts raised their profit projections. Though the changes did not move the Zacks Consensus Estimate from its current level of 9 cents per share, they did contribute to a more bullish most accurate estimate of 11 cents per share. Marvell Technology is scheduled to report on Thursday, Aug 27, after the close of trading.

Companies That Could Issue Negative Earnings Surprises

During the past few weeks, fiscal fourth-quarter projections on Energy Conversion Devices (ENER: 12.549 +0.189 +1.53%) have been cut. The negative revision caused the Zacks Consensus Estimate to worsen by a penny to a loss of 5 cents per share. The most accurate estimate is even more bearish at a loss of 12 cents per share. Given that ENER missed expectations last quarter, the negative revisions signal that another disappointment could occur. Energy Conversion Devices is scheduled to report on Thursday, Aug 27, before the start of trading.

Intervention Threatens The Loonie

When the U.S. sneezed, Canada - like the rest of the world - caught its cold. And the currency of this key U.S. trading partner has since become a victim of the ebb and flow of global risk appetite.

For instance, last year, when uncertainty was high and money fled to the center of the global economy, the U.S. dollar and the Canadian dollar fell sharply.

Now that risk appetite has returned to the global financial markets and money is flowing back out of the U.S. dollar, Canada’s loonie has had a strong recovery. In fact, the Canadian dollar has rallied 20 percent against the U.S. dollar from its weakest point last March.

As for the economy, recovery is on track in Canada. But Canadian officials are worried about the recent strength of their currency. They’re concerned it has already dampened the path to recovery and could ultimately derail it.

Intervention Threats …

The governor of the Bank of Canada (the nation’s central bank) has said that a stronger Canadian dollar was a major risk to economic growth. And the Canadian finance minister has signaled that steps might be taken to dampen the volatility in their currency.

The loonie has had a strong rally. Now the government is threatening intervention.

These are huge statements - attempts to influence market sentiment. Of course, the next step is physically doing something about it.

Official intervention is when a central bank (or an agent of the government) buys or sells foreign currency in an attempt to influence exchange rates. In the past, many governments have intervened in foreign exchange markets to try to:

  • Stop the appreciation of their currency,
  • Defend against the depreciation of their currency,
  • Or to simply slow the movement of its currency.

As you can see in the chart below, the Canadian dollar (the white line) has been dragged around by the “risk” trade and has been tracking the performance of the S&P 500 (the orange line) very tightly.

Canadia Dollar and the S&P 500

Source: Bloomberg

The S&P 500 (^GSPC: 1034.54 +8.41 +0.82%) has been the proxy for risk appetite and perception of economic recovery in the U.S. As optimism about the outlook for a global recovery has gradually improved since March of this year, so has the strength of the stock market … and, therefore, so has the strength of the Canadian dollar.

Fundamentals Point In Canada’s Favor …

The big Canadian banks managed to mostly steer clear of the load of toxic assets that crushed American and European banks. Its banking system was considered the world’s soundest last year … they required no new capital and remained profitable.

Canada implemented a $32 billion stimulus package to boost its economy.

Even so, Canada recognized the exposure of its economy to the growing global recession and acted aggressively in coordination with five other central banks to begin slashing interest rates down to near zero. In addition, Canada rolled out a fiscal stimulus package.

Still, the economic consequences from recession have been harsh for Canada, as a neighboring country that relies so heavily on the health of the U.S. economy.

Indeed, the IMF expects Canada to contract 2.3 percent and then return to an anemic 1.6 percent growth next year. Those forecasts are expected to outperform the U.S. in both 2009 and 2010.

On a relative basis then, the Canadian dollar should be outpacing the U.S. dollar. But currencies aren’t trading on relative growth right now. It’s all about the risk environment.

So if you think the fundamentals of the recovery are robust, you might expect global stock markets and the Canadian dollar to go higher. Alternatively, if you think that there are growing question marks about the sustainability of the recovery, you’re anticipating that investors will rein in risk, and stocks and the Canadian dollar will go lower.

For clues, let’s look at …

The Technical Picture For the Loonie …

Below is a weekly chart of the U.S. dollar/Canadian dollar exchange rate. You can see the tight downtrend from 2001 to 2007.

For Elliott Wave aficionados, this chart looks very interesting. The five wave downtrend is now being corrected through an impulsive A-wave, a corrective B-wave and a potential impulsive C-wave that projects the U.S. dollar/Canadian dollar exchange rate toward the $1.50 mark.

In others words, the technical set-up indicates a rising U.S. dollar and a sinking Canadian dollar.

U.S. Dollar vs. Canadian Dollar (weekly)

Source: Bloomberg

The technical picture creates a viable bearish scenario for the Canadian dollar. And with the added element of intervention talk, betting on a lower loonie makes for an attractive risk/reward trade.

To avoid conflicts of interest, Weiss Research and its staff do not hold positions in companies recommended in MaM, nor do we accept any compensation for such recommendations. The comments, graphs, forecasts, and indices published in MaM are based upon data whose accuracy is deemed reliable but not guaranteed. Performance returns cited are derived from our best estimates but must be considered hypothetical in as much as we do not track the actual prices investors pay or receive.

4 Reasons Active TIPs ETFs Could Be Needed

Active management in exchange traded funds (ETFs) is said to be only worthwhile as long as it provides better returns than the passive counterparts. Are there enough inconsistencies in the Treasury inflation protected securities (TIPS) market to warrant an active hand?

Allianz’s Pacific Investment Management Co. (PIMCO) says that TIPs often lead to missed opportunities and hidden costs, reports Ian Salisbury for The Wall Street Journal. TIPs adjust their principal to match rising prices, or in other words, they are Treasury bonds that hedge against inflation.

TIPs have rallied this year on worries over inflation, which could arise as a result of the copious government stimulus efforts. PIMCO has filed with the Securities and Exchange Commission (SEC) to launch TIPs-related ETFs in an attempt to get in on the investor interest, and all four would be index funds.

PIMCO’s paper, written by John Cavalieri, Gang Hu and Mihir Worah, points out four areas of inefficiency in the TIPS market that could be corrected through proper management during specific segments of the year or changes in the shape in the yield curve:

  • Passive investors can incur larger transaction fees than active investors in the TIPs market, and passive investors won’t be able to time transactions during the day to take advantage of market imbalances that could occur at the end of the day.
  • TIPs ETFs rebalance periodically and active investors can capture alpha by purchasing securities at artificially depressed prices after rebalancing.
  • TIPs auctions create market inefficiencies. The funds can lose out on a chance to trade in periods when supply and demand are out of whack.
  • TIPs prices also shift according to the seasonal patterns in the underlying inflation index.

Vanguard agrees with this assessment and is in favor of active management in TIPs funds. Barclays, however, dismissed Pimco’s findings, stating that ETFs trade less frequently than active funds, which lowers costs. Furthermore, Barclay insists that costs incurred are easier to judge since they are rolled into bid-and-ask spreads that investors see upon trades.

According to Robert Huebscher for Advisor Perspectives, active managers won’t be able to outperform the passive TIPs ETF in net fees, and in an attempt to outperform passive funds, active managers will also be more inclined to take excessive risks. Huebscher also notes that PIMCO may be more biased toward active management since a major chunk of the company’s revenue comes from actively managed bond portfolios.

  • SPDR Barclays Capital TIPS (IPE: 50.12 -0.04 -0.08%): up 6.3% year-to-date

ETF IPE

  • iShares Lehman TIPS Bond (TIP: 101.7649 -0.0651 -0.06%): up 5% year-to-date

ETF TIP

Chicago Fed Index Increases For 6th Straight Month

The Chicago Fed National Activity Index was -0.74 in July, up from -1.82 in June. All four broad categories of indicators improved in July, while three of the four continued to make negative contributions to the index. Production-related indicators made a positive contribution to the index for the first time since October 2008 and for only the second time since December 2007.
The three-month moving average, CFNAI-MA3, was -1.69 in July, up from -2.18 in the previous month. July’s CFNAI-MA3 suggests that growth in national economic activity was below its historical trend. With regard to inflation, the amount of economic slack reflected in the CFNAI-MA3 indicates low inflationary pressure from economic activity over the coming year.

The improvement in the index in July was due in large part to the production and income category of indicators. This category made a contribution of +0.26 to the index in July compared with -0.38 in June. Manufacturing production increased 1.0 percent in July, its biggest increase since December 2006, following a decline of 0.5% in the previous month. In addition, manufacturing capacity utilization increased to 65.4 in July from 64.7 in June.

MP: The Chicago Fed National Activity Index (CFNAI-MA3) has increased in each of the last six months, the first six consecutive monthly increase since the end of the 2001 recession, see bottom chart above.

A Quick Look At The Weekly Commodity CRB Index

With markets at potentially major turning points - one way or the other - let’s take a quick look at the CRB (Commodity) Index (I:CRY0.NYB: 259.52 +0.28 +0.11%) for a possible clue.

One almost has to look at the weekly chart to appreciate the price damage broad commodities took in 2008 - it was stellar.

Now, price is forming a counter-rally against last year’s plunge, but price has retraced upwards into a critical resistance area that needs to be addressed.

The $260/$270 Index area reflects the falling 50 week EMA along with the weekly upper Bollinger Band line - both of which are expected to hold as resistance (until breached convincingly).

If this week closes about the same index level as we’re seeing on this chart, then we’ll have formed a doji candle at this overhead potential resistance area, which furthers the odds that resistance will hold.

Then again, if this level is broken to the upside, we would have an “Open Air” scenario where all levels of ‘obvious’ weekly resistance would be broken which would likely result in a momentum move up to the $320 level.

As a note, key Fibonacci price levels to watch are as follows (not labeled):

38.2%:  $305
50.0%:  $335

Let’s see how buyers/sellers react at this technical (price) level for additional clues to what’s in store for the future.

Coca-Cola On Investment Spree

Coca-Cola Co. (KO: 49.53 -0.38 -0.76%) and its bottlers are planning to invest more than $5 billion in Mexico over the next five years. The investment is primarily targeted at developing infrastructure, technology, social and environmental programs, marketing, training and products with special emphasis on employment generation.

The new investment is expected to revive Mexico’s economy, which is facing the brunt of the recession due to reduction in imports by the U.S., its primary trade partner. Further, a decrease in tourism due to the swine-flu epidemic has worsened the condition.

Recently, Coca-Cola established a new plant for a juice company Jugos del Valle in Tepotzotlan , Mexico . The total investment for this plant amounted to $200 million, which is expected to generate employment opportunities for about 1,500 people. In addition, the plant is expected to have 20 bottling lines and an annual production capacity of 140 million beverage crates.

In July 2009, Coca-Cola Company and its bottling partner had undertaken expansion in China with the opening of two new bottling facilities, in the less developed central and western China. Coca-Cola also invested more than $2 billion in Russia.

The company’s arch rival PepsiCo (PEP: 57.52 +0.03 +0.05%) already announced plans to invest up to $3 billion in Mexico over the next five years to stimulate growth of beverage brands along with Sabritas and Gamesa snacks. About $2 billion of the Mexican investment will fund the overall research and development, manufacturing, distribution, marketing, and advertising activities. Approximately $1 billion will support the Pepsi beverage system in Mexico. Also, a part of the investment will support the introduction of key Mexican traditional brands into the U.S. market.

PepsiCo has started investing $1 billion in China over a period of four years beginning 2008 for the expansion of manufacturing capacity. The investment would also fund local research for development of new products tailored for Chinese consumers, in addition to expansion of its sales force and for brand-building initiatives.

PepsiCo also plans to invest $1 billion in the Russian market as part of its strategy to drive additional growth in key developing markets. Additionally, the company also plans to boost its manufacturing and distribution capacity in Russia

Chart Analysis And The Manipulation Factor

As the dollar headed south over the last 6 months, many wondered if it was about to collapse. Hedge funds, mutual fund managers, individual traders and investors had and are still short the dollar. The rally since March has coincided directly with the fall in the dollar. The yearly highs on the dollar were made in the first week of March and sure enough, the low of 666 on the S&P 500 (^GSPC: 1033.69 +7.56 +0.74%) was also hit in the first week of March. Clearly, the rally has been a re inflation rally but there are other factors at work. The Federal Reserve has been a direct culprit of weakening the dollar. Believe it or not the dollar’s drop was an obvious method of the Federal Reserve and possibly the PPT (Plunge Protection Team) to stop the markets from collapsing.

While technical analysis provides us with almost every major and minor move of the markets, oil, gold and the US Dollar, common analysis of motives of the Federal Reserve must also be analyzed. This adds a new dimension to confirm and solidify the technicals. We all know the Federal Reserve has been printing money, trillions in fact. Money to buy bonds, bailout banks, stimulus packages and more. However, it goes even deeper.

Ever since the run up in the markets dating back to 2006 to 2007, oil stocks and other commodities have been added to the S&P 500. The weighting has increased more and more. This has made it so the market’s overall are tied extremely tightly to the price of oil and other commodities. Therefore, the price of commodities is directly related to the levels of the S&P and other indexes. To manipulate the price of commodities higher would have a direct bailout effect on the markets. When oil is higher, the markets are higher.

Knowing this, it is no wonder that when the dollar topped out in March, the markets also bottomed. The Federal Reserve has a direct impact on the dollar. They are the printers or the money tree of the markets and the United States. This, alongside the bailouts and stimulus packages (which are both dilutive and cause the markets to drop) were bullets in their gun to help the markets regain their strength.

The problem is, it is a double edged sword. While causing the dollar to fall in the near term has helped the markets regain their mojo, it can have very detrimental effects. Our country is financed by other countries as they buy our debt. This is seen in the form of bond auctions where the interest paid is on the rise. If the dollar is losing value rapidly, other countries do not want to buy our debt. This is mainly due to the fact that in 10 years, 20 years or 30 years, these countries expect the dollar to be valued much lower based on the current drop priced out over those longer time periods. The only way they will buy the debt is if a higher interest rate is paid making up for the dollar’s drop plus a profit. So, while a dropping dollar is great for the markets in the near term, if the money flow is turned off, we could spiral into a new liquidity problem even worse than what we saw in late 2008 and early 2009.

Now looking closely at the dollar recently, InTheMoneyStocks Chief Market Strategists saw a major technical support level on the dollar. On the UUP (UUP: 23.23 0.00 0.00%) (dollar ETF) it was at $23.00-$23.05. This happened to be a major pivot from 2008. Closer calculations revealed it was a monstrous support level and cycle level as well. While this was a dead on indicator that the dollar was about to bounce, the Manipulation Factor confirmed it. What was this manipulation factor?

As the dollar approached the major 2008 support level, Chief Market Strategists also realized that in the coming days there was a 3 year, 10 year and 30 year auction. There was no way the Federal Reserve was going to let the dollar continue to collapse into this auction. Why not? Because foreign countries, our debt buyers would be less inclined to bid on it in a free fall. In other words, push the dollar higher into the auctions to increase the likelihood of buyers willing to purchase the bonds for a lower interest rate.

Sure enough the dollar rallied on the InTheMoneyStocks call. This new factor, the Manipulation Factor must be used in conjunction with technical analysis. It is a great confirming indicator and can truly help one make profits. Look at the bigger picture; it was clear as a bell in this case.

Learn the game. Nothing is as it seems but a well educated investor can be aware and avoid the traps even profiting from the Manipulation Indicator.

Markets At Critical Inflection Points

I wanted to show you a quick “Weekly Fly-by” chart comparison of the 10-Year Notes, S&P 500 (^GSPC: 1033.69 +7.56 +0.74%), Crude Oil, and US Dollar Index to note key inflection points across all markets - with key markets at such important inflection levels, a push either way will clue us in to what’s ahead for the next few months.

10-Year Notes:

Without making this a lengthy post - I describe all these in detail (along with gold) in my Weekly Intermarket Subscription Service (which is released each Sunday evening) - let’s hit the main highlights across each market.

Notes are struggling to overcome confluence EMA resistance at the $118 level, which also corresponds with the 50% Fibonacci (at $117.55) of the 2007 lows to the 2009 highs.  Another level to watch is the $114.50 level, which has held in 2009 as prior price support - it is also the 61.8% Fibonacci retracement of the same move.

A break above $119 should lead to a momentum move to upside just as a break beneath $114 would lead to a momentum move to the downside.

S&P 500:

With all eyes focused on the current S&P 500, price has broken above the major resistance at 1,007 and 1,014 (as shown above) to close just shy of 1,030.  A continued move higher beyond this zone will likely lead to a momentum push to the 1,100 level for the next likely ‘magnet’ zone.

It seemed like the market was having difficulty overcoming the 1,014 level - let’s see how next week plays out - a clean break above 1,030 will lead to a likely test of 1,100 before long, though an inflection move down will lead to a potential test of 875.

Crude Oil:

Just like the S&P 500, Crude Oil is challenging overhead resistance about the current $75 region (which has been a price target since early 2009).  We’re here now, and we have the 200 week SMA just above us.

To put this rally into perspective, even though price rose almost 100% in Crude Oil, the rally failed to achieve even the 38.2% Fibonacci line of the entire ‘bear market’ slide from 2008 to 2009.

A break above $75 and especially $80 will likely lead to a move to challenge $90, though a move down here could send crude as low as $40 should news on the ‘green shoots’ in the economy sour.

US Dollar Index:

Finally, the US Dollar Index is hovering on absolutely critical support - a make or break area.  Price is hovering at the $78 level, which is the 61.8% Fibonacci retracement of the 2008 lows to the 2009 highs.  Price has found support here prior, so it’s worth watching closely.

As usual, a break beneath $78 could lead to a move down to the $71 area, though there’s plenty of overhead resistance as shown by upper Fibonacci levels along with confluence EMAs to challenge a rising dollar.

Again, I’ll take a look at each of these markets - along with Gold in its consolidation triangle - on the Monthly, Weekly, and Daily timeframes in this week’s (and every week’s) Intermarket Report for Premium Subscribers.

To recap, bonds appear to be at resistance; Stocks appear to be at resistance; Crude Oil appears to be at Resistance; and the US Dollar Index appears to be at support.

This is how studying intermarket (related) charts can add insights into your own market by watching the technical (trend) structure of related (or non-related) markets.

I’m reminded of the teaching of Mark Douglas (Trading in the Zone) when he said “It’s best to find areas where a market HAS to make a move (inflection point) and then once that inflection up or down occurs, then join the move in progress (instead of getting ego involved and trying to predict the outcome)”  [loose quote]

Take the time to study these markets this weekend - we could be in either for a major turn… or shattering of these levels which would be impressive and would lead to continuation of current trends (bullish for stocks/commodities, bearish for bonds and the Dollar).

Prepare Yourself For The Inflation Invasion

Inflation Expectation Eases

The Treasury Department, responding to growing demand from China and other investors, will boost the sale of inflation protected bonds, i.e., TIPS. Chinese officials had indicated they want inflation-protected securities, especially as the U.S. economy starts to recover.

TIPS value fell after the announcement. The spread between TIPS and comparable Treasury Notes ended at around 1.93%, signaling that investors expect annualized inflation of 1.93% over the next decade. However, this is still below both the average 2.8% of the past 10 years, and the 2.1% at the end of last year.

Inflation’s Twin Tale

Most analysts are of two minds about inflation: One tends to argue that the Fed’s printing of new money would lead to explosive inflation or even “hyperinflation.” The other group argues that there is too much “slack” in the economy for prices to rise, i.e., a stagnation scenario, due to high unemployment, falling wages, plunging home values, and damaged 401ks. So far, the latter view seems to have held up better.

Growth of Money supply

At the moment, both inflation and deflation are seemingly off the radar based on the latest consumer and producer prices. Realistically, we can’t ignore the inevitable inflationary effect from the government’s quantitative easing program.

Since the start of this global economic crisis, the U.S. government has been injecting massive amounts of new currency into the financial system to prevent deflation and stimulate economic growth. M2, a measure of money supply that includes checking accounts and money-market mutual funds, has grown about 16% over the last 12 months, or a colossal $1.12 trillion increase. All that money is going to find a home. This phenomenon will eventually devalue the dollar and push price inflation much higher, which is also referred to as reflation.

Betting on Inflation

Warren Buffett said on Aug. 18 that the U.S. must address the massive amount of “monetary medicine” that has been pumped into the financial system and now poses a threat to the economy and the dollar.

In reality, the Fed will likely be slow to act, in part because of the still high unemployment rate, which rose to 9.7% in July, from 7.2% in December. So the U.S. has got a lot of inflation or even hyperinflation issues to worry about in the future.

Meanwhile, Pictet Asset Management, which manages $60 billion in fixed-income assets, reportedly is buying U.S. inflation-protected bonds, betting that the government’s economic-stimulus measures will fuel price growth.

W-shaped vs. V-Shaped

Prominent Harvard economist Dr. Martin Feldstein indicated that the U.S. economy has improved, but he wondered “if the current recovery is really sustainable” or whether there could be “another slowdown or indeed downturn after the third or fourth quarter”.

Judging from the recent commodities rally, we may have inflation, for example, in food and energy, while deflation in the rest of the economy. If this stagflation scenario emerges, we will likely experience a W-shaped recovery instead of a V-shaped one.

Commodities Rock & Rule

A large spike in prices for goods and services is expected once we finally emerge from this global economic crisis, which could be in a year or so. Hard assets such as oil, agricultural products and precious metals will experience substantial price appreciation in this future high inflationary environment. Therefore, commodities are well positioned as a sector with likely strong growth prospects over the next decade.

Investing Strategy

Based on this analysis regarding inflation and a likely W-shaped recovery scenario, here are some ideas of potentially profitable plays to consider:

Precious Metals ETFs: SPDR Gold Trust (GLD) & iShares Silver Trust (SLV)
Hard Assets ETF: Market Vectors RVE Hard Assets Producers ETF (HAP)
Agriculture Commodities ETF: PowerShares DB Agriculture Fund (DBA)
Metals Equity Play: Freeport McMoRan (FCX), BHP Billiton Ltd. (BHP)
Crude Oil Producer: Petroleo Brasileiro SA (PBR), ExxonMobil (XOM)

A Quick Review Of SIPC’s Investments

Given the concerns I have raised about the investment portfolio of FINRA, I wondered if the same problems may reside within the investment portfolio of SIPC (Securities Investor Protection Corporation).

In the process of looking through SIPC’s Annual Reports and Financial statements for the last 4 years (SIPC Annual Reports), I see that SIPC holds approximately $1.7 billion in U.S. government securities. Whatever else one may want to say about SIPC, the fact is its investment portfolio is positioned appropriately given the nature of the organization and its work.

Contrast SIPC’s portfolio with that of FINRA’s which up until this past April held a mix of common equities, fixed income, hedge funds, fund of funds, and private equity. Given the nature of FINRA’s work, why didn’t it strictly hold U.S. government securities as well? What answers lie within that FINRA portfolio?

I will not absolve SIPC completely. In his “Message from the Chairman” in SIPC’s 2007 Annual Report, SIPC Chair Armando J. Bucelo, Jr. made a statement which he would probably like to retract. Bucelo wrote:

The year 2007 saw an event which has never previously occurred in the 37 year history of SIPC. During the year, SIPC was not called upon to initiate a customer protection proceeding for any SIPC member brokerage firm. Indeed, in the four year period from 2004 to 2007, SIPC was called upon to initiate proceedings for a total of only six brokerage firms. This is the lowest number of new proceedings during any four year period in our corporate history. As I have mentioned before in previous Annual Reports, I attribute this extraordinary result to the vigilance of the Securities and Exchange Commission, the Financial Industry Regulatory Authority, and the state regulators, who assure customers that their assets are properly segregated and that brokerage firms maintain capital adequacy.

I will grant that Mr. Bucelo was clearly currying favor with his regulatory colleagues; however, while these regulators were sleeping, the seeds of destruction on Wall Street were growing strong.