
I wanted to show you a quick “Weekly Fly-by” chart comparison of the 10-Year Notes, S&P 500 (^GSPC: 1033.69 +7.56 +0.74%), Crude Oil, and US Dollar Index to note key inflection points across all markets - with key markets at such important inflection levels, a push either way will clue us in to what’s ahead for the next few months.
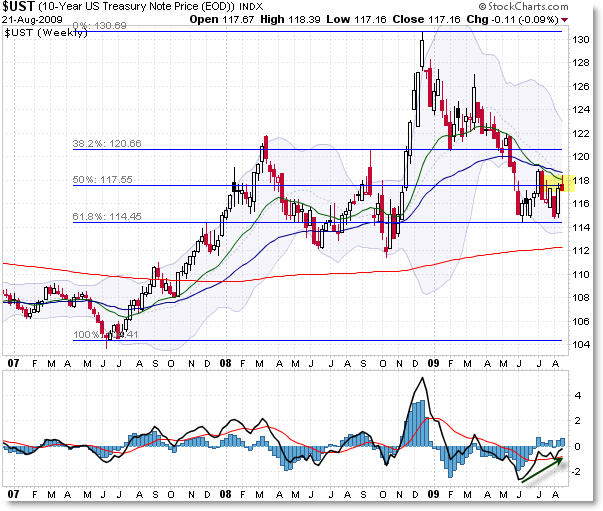
10-Year Notes:
Without making this a lengthy post - I describe all these in detail (along with gold) in my Weekly Intermarket Subscription Service (which is released each Sunday evening) - let’s hit the main highlights across each market.
Notes are struggling to overcome confluence EMA resistance at the $118 level, which also corresponds with the 50% Fibonacci (at $117.55) of the 2007 lows to the 2009 highs. Another level to watch is the $114.50 level, which has held in 2009 as prior price support - it is also the 61.8% Fibonacci retracement of the same move.
A break above $119 should lead to a momentum move to upside just as a break beneath $114 would lead to a momentum move to the downside.
S&P 500:
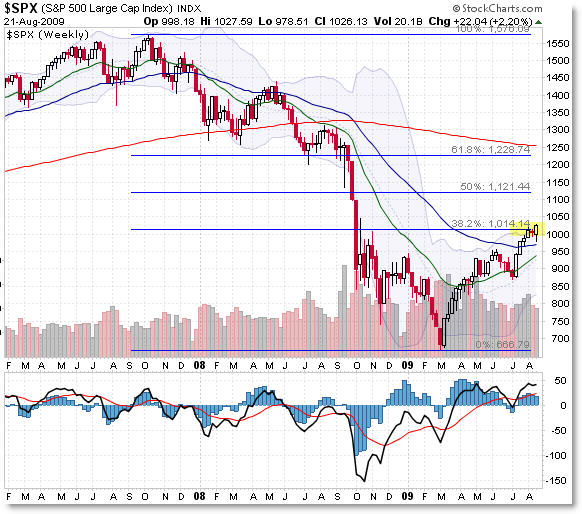
With all eyes focused on the current S&P 500, price has broken above the major resistance at 1,007 and 1,014 (as shown above) to close just shy of 1,030. A continued move higher beyond this zone will likely lead to a momentum push to the 1,100 level for the next likely ‘magnet’ zone.
It seemed like the market was having difficulty overcoming the 1,014 level - let’s see how next week plays out - a clean break above 1,030 will lead to a likely test of 1,100 before long, though an inflection move down will lead to a potential test of 875.
Crude Oil:
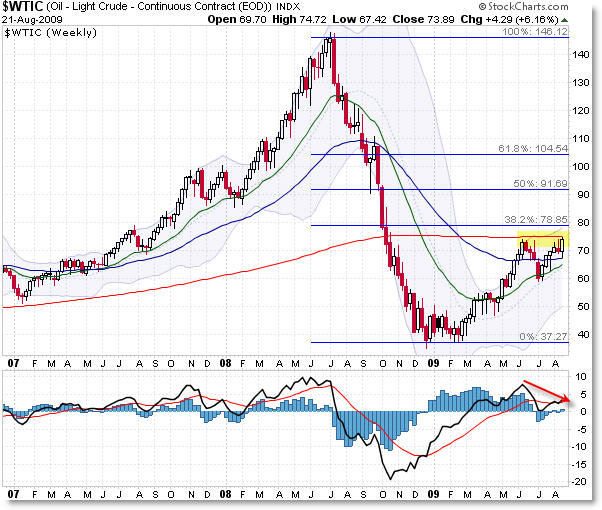
Just like the S&P 500, Crude Oil is challenging overhead resistance about the current $75 region (which has been a price target since early 2009). We’re here now, and we have the 200 week SMA just above us.
To put this rally into perspective, even though price rose almost 100% in Crude Oil, the rally failed to achieve even the 38.2% Fibonacci line of the entire ‘bear market’ slide from 2008 to 2009.
A break above $75 and especially $80 will likely lead to a move to challenge $90, though a move down here could send crude as low as $40 should news on the ‘green shoots’ in the economy sour.
US Dollar Index:
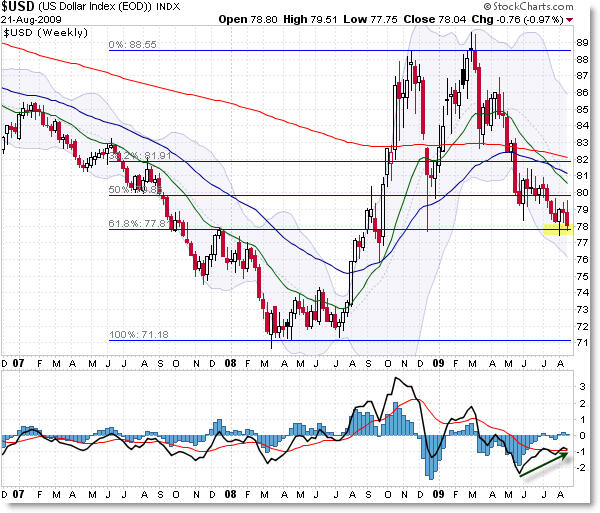
Finally, the US Dollar Index is hovering on absolutely critical support - a make or break area. Price is hovering at the $78 level, which is the 61.8% Fibonacci retracement of the 2008 lows to the 2009 highs. Price has found support here prior, so it’s worth watching closely.
As usual, a break beneath $78 could lead to a move down to the $71 area, though there’s plenty of overhead resistance as shown by upper Fibonacci levels along with confluence EMAs to challenge a rising dollar.
Again, I’ll take a look at each of these markets - along with Gold in its consolidation triangle - on the Monthly, Weekly, and Daily timeframes in this week’s (and every week’s) Intermarket Report for Premium Subscribers.
To recap, bonds appear to be at resistance; Stocks appear to be at resistance; Crude Oil appears to be at Resistance; and the US Dollar Index appears to be at support.
This is how studying intermarket (related) charts can add insights into your own market by watching the technical (trend) structure of related (or non-related) markets.
I’m reminded of the teaching of Mark Douglas (Trading in the Zone) when he said “It’s best to find areas where a market HAS to make a move (inflection point) and then once that inflection up or down occurs, then join the move in progress (instead of getting ego involved and trying to predict the outcome)” [loose quote]
Take the time to study these markets this weekend - we could be in either for a major turn… or shattering of these levels which would be impressive and would lead to continuation of current trends (bullish for stocks/commodities, bearish for bonds and the Dollar).


0 comments:
Post a Comment