
GOLD : LONG TERM
The U.S. $ gave a sharp advance on Friday, gold in turn had a sharp drop. At this time I would not place too much emphasis on either event. From a long term stand point things do not reverse on a dime. The $ is still in a long (and intermediate) term bear trend although it has now shown that it is in a short term rally. The long term perspective of the gold trend remains positive (the shorter term trend we will visit later). My long term P&F chart is still a long way away from any reversal signal.
As for the normal indicators, the price of gold remains well above its positive sloping moving average line and the momentum indicator remains in its positive zone still above its positive sloping trigger line. The volume indicator is above its positive trigger line but unfortunately it is not showing the long term strength one would like to see. Still, the long term rating remains BULLISH.
INTERMEDIATE TERM
The intermediate term indicators continue to be positive although some are starting to show signs of turning. Gold price remains above its positive moving average line but the price is starting to trend lower towards the line. The intermediate term momentum indicator is still in its positive zone but has crossed its trigger line on the down side. The trigger line itself has turned negative on Friday. The volume indicator has been tracking a basically lateral path but remains above its positive trigger line. All in all, the intermediate term rating remains BULLISH for now.
SHORT TERM
The indicators are starting to fall apart from the short term perspective. The price of gold has closed just below its short term moving average line, however, the line itself has not yet turned to the down side to confirm the break. As confirmation of the bullish short term trend in motion the very short term moving average line had crossed the short term line to the up side in mid-April. It has remained there since. Although the very short term line has turned downward it is still above the short term line and has not confirmed any short term reversal of trend yet. The short term momentum indicator is still in its positive zone but heading lower rapidly. It is already below its trigger line and the line itself is trending lower. The daily volume activity is relatively low and suggests that there is not much real panic behind the latest downside action. The short term rating has weakened but not yet all the way to the bearish level. It is one notch above the bear, at a – NEUTRAL rating.
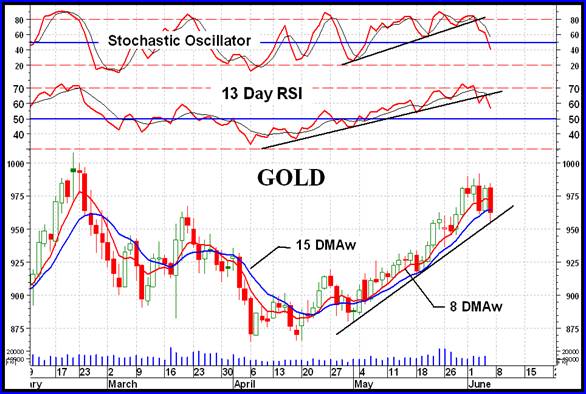
As for the immediate direction of least resistance, well, that seems to be towards the down side. Gold price is below the very short term moving average line and as mentioned above, the line has turned downwards. The aggressive momentum indicator, the Stochastic Oscillator, is in a steep decline and has moved into its negative zone. It and the short term momentum had broken their up trend lines which is normally an advance warning of the trend change. Although the price is still above its up trend line we should expect it to move below the line very soon.
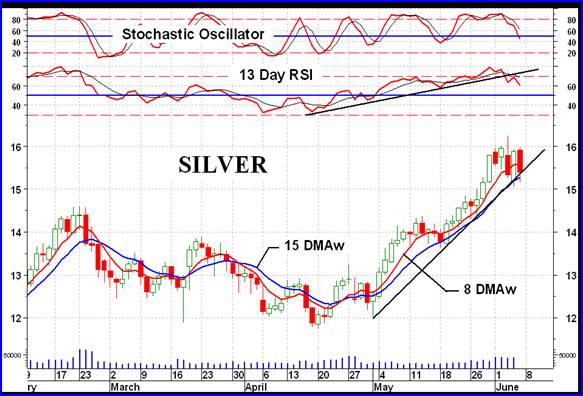
SILVER
The short term chart of silver is very much like that of gold, except for the fact that silver had far exceeded its previous February high while gold had not. Last week I cautioned about the fact that the short term momentum and Stochastic Oscillator (SO) had entered their overbought zones and that a rest or reaction might be expected soon. Well, it looks like that’s what we are getting here. The momentum indicators are moving sharply lower and the SO is already in its negative zone. As with gold, the short term momentum indicator has broken below its up trend line. The price is still above its up trend line and short term moving average line but could break below momentarily. The one indicator still maintaining some strength is the very short term moving average line, which remains above the short term line. Both the intermediate term and short term ratings for silver remain BULLISH but are getting close to being downgraded soon.
PRECIOUS METAL STOCKS
Let me immediately present what I think is still the good news. Gold and silver stocks, although they may be going through or on the verge of going through a rest or reaction period ahead, do not look like they are into a reversal of long term trend, which is still to the up side. One of the features of a bull market ending is that the more speculative stocks, you know, the cats and dogs, top out and start their bear trends first. Well, we are nowhere near that yet. Both the most aggressive gold Index, the Merv’s Gamb-Gold Index, and the aggressive silver Index, the Merv’s Spec-Silver Index, remain in the up direction with gains on the week. These two very speculative Indices were the only gainers of any North American gold or silver Indices this past week. Both are moving higher into new recovery highs. This is not the action usually associated with a gold or silver market top. That is not to say they will not partake in any rest or reaction period along with the rest of the stocks, it’s just that a reversal of basic trend is not envisioned at this point.
During the week only 4 of the 30 quality stocks in the Merv’s Qual-Gold Index gained ground. Over at the most speculative Merv’s Gamb-Gold Index, a full 16 of the 30 stocks gained ground this week. Now, one week does not mean anything as far as longer term trends are concerned but it is another indication that the speculative fever has not been eradicated and that we are not yet in a top area for the gold and silver stocks.
To slightly expand upon my last week’s simple buy/sell technique there is always the question of what to do during a trend if one should have missed the initial buy or sell signal. See last week’s commentary for the initial signals. During a trend one SHOULD NOT chase after a stock if it has already made a significant move. You are most likely near a top of some sort. Wait for the trend to halt and get in on the next move. What will usually happen is that the price will drop below the short term moving average line for awhile. A reasonable time for a continuation buy is when the price moves above the short term moving average line and especially if the moving average line is sloping in an upward direction. One actually might want to wait for the line to be in an upward direction as an extra reduction of risk. One should NEVER buy stock if it is trending below the short term moving average line. At that point you just don’t know if the price is in its very early reversal of longer term trend stage or if the price is just in a short rest period. Wait for the price to be above the short term moving average line before buying.
On the sell side things are just a little different. On the buy side one is looking to maximize profits. On the sell side one is looking to preserve capital. If one did not sell at the initial sell signal it is very difficult (psychologically) to sell later at an even greater loss. However, remember that preservation of capital should be your most important goal here, so that you have capital to invest or speculate with at a later more convenient time. It is never too late to sell, once you have reached the stage where you have admitted that the stock has turned on you. Waiting for the right time for a continuation sell point may cost you considerably more capital. Sell, once you have gained the courage to do so.
Merv’s Precious Metals Indices Table
Well, I think I’ll call it another week.


0 comments:
Post a Comment