
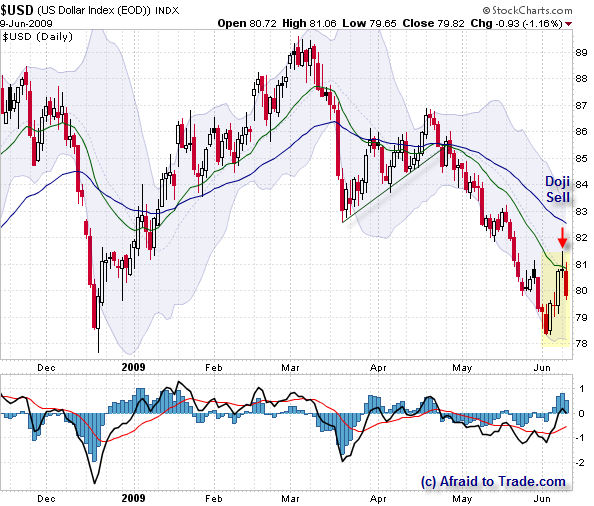
Are lower prices ahead for the US Dollar Index? Let’s look at a possible powerful sell-signal example as price has formed a classic retracement into resistance, formed a doji candle, and plunged lower off this signal.
US Dollar Index Daily:
I’ve mentioned a few times on the blog in the past regarding the Bear Flag setting up and completing on the daily chart.
We’ve gotten an expected bounce off the price projection lows of the flag (price slightly exceeded its downside target actually).
The bounce was a sharp, quick reaction back to the 20 EMA which formed a long-legged reversal gravestone doji candle which triggered an aggressive short-sell signal.
Today, we see the downward inflection off this clear sell signal and odds now favor a test of the lows in June or below.
The larger trend is down, the moving average structure is in the most bearish position possible… but there is a positive momentum divergence so you probably should take that into consideration as well (meaning, don’t expect price to go screaming down off this level).
Let’s follow this pattern out and perhaps use it as an educational example of how trend, candles, and moving averages combine to set-up powerful, low-risk opportunities.


0 comments:
Post a Comment