
With 2009 coming soon to a close, I thought it would be a good idea to put major markets into perspective by looking back to 1999 to 2009 on the monthly charts of the S&P 500, NASDAQ, US Dollar Index, Gold, and Crude Oil.
First, the S&P 500:
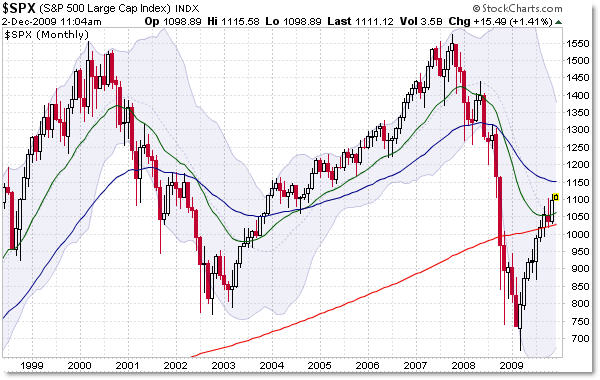
The S&P 500 peaked at 1,550 in early 2000 and late 2007 - both signaling market tops that price was unable to breach.
The current price of 1,100 is 30% lower than the 2000 and 2007 peaks after a stellar rally from the March lows. As great as the rally has been, we’re still in the midpoint from peak to decline (actually we’re almost exactly 50% from the high to the 2009 lows).
I can’t help but note a similarity to the rise from early 2003 into early 2004 which resembles the current rise, though the current rally has covered more price and percentage change than the 2003 ‘full year’ rally (2009 looks like a ‘full year’ rally with the exception of January and February).
Still, at 1,100, we’re beneath the 1,300 level that price was trading at the start of 1999 - that’s 15% under where price began 1999.
Next, the NASDAQ:
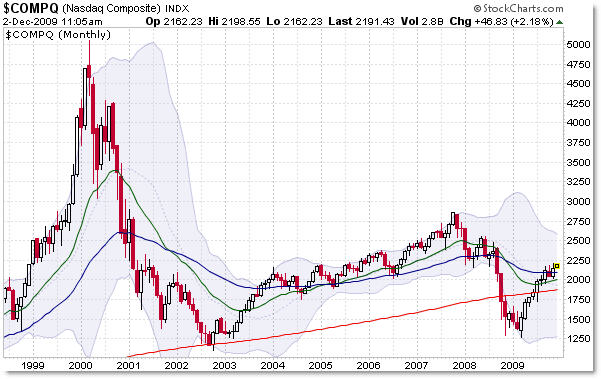
People often forget how devastating the NASDAQ “crash” was in 2000 and 2001, and that it will take many more years if not a decade or more to reach the 5,000 index peak seen as 2000 began.
With price currently at 2,250, that’s still 55% beneath the 5,000 price peak and we’re still under the 2,500 level the NASDAQ traded when January 1999 began (10% beneath).
We’re about 25% down from the 2007 peak near 2,800.
Crude Oil:
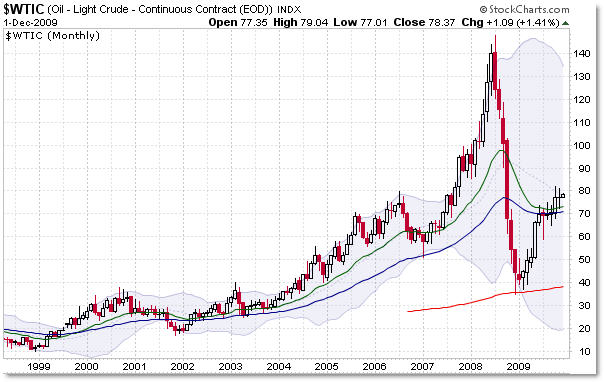
Next to Gold, Crude Oil was the ‘darling’ of the 2000s… with the exception of the 2008 price collapse from $147 to $35 per barrel.
Price began 1999 near $12 per barrel and then peaked in mid-2008 at $147 a barrel - an amazing and stratospheric 1,100% rise from low to peak.
Price still remains well above the 1999 level, trading currently at $80% (550% higher than 1999’s start) but still roughly 50% beneath the 2008 price peak.
Gold:
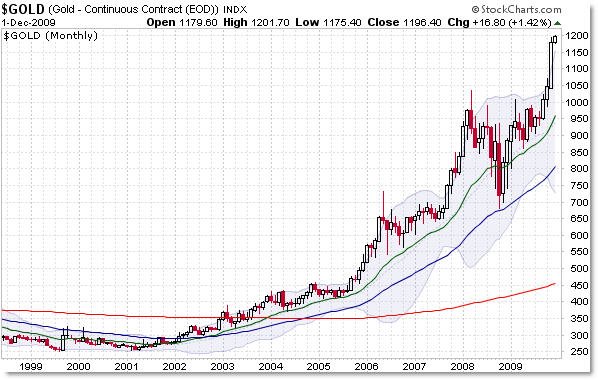
Gold will likely be the ’story market’ of the decade of the 2000s. Price began 2000 at $300 per ounce and is currently trading 400% higher at $1,200 per ounce. As of this writing, there is no end in sight, with prominent market analysts calling for $1,500, $2,000 or even higher price targets.
Gold, unlike Crude Oil, has more than recovered its $1,000 price peak in mid-2008 when Crude Oil peaked at $147 per barrel. In fact, gold is roughly 20% higher than its 2008 price peak (keep in mind the S&P 500 is still down 50% from its 2007 peak).
The US Dollar Index:
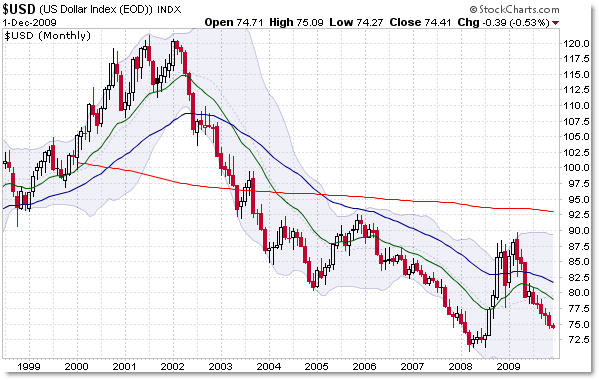
The market that has suffered most is that of the US Dollar (Index). The Dollar Index began 1999 at the $95 Index level, rose prominently until its mid-2001 peak above $120… and fell all through the decade with the exception of 2005 and late 2008. Price remains in a primary downtrend.
While the chart may look terrifying, in percentage terms, the Index is ‘only’ down 25% from where it began 1999 at $95, and is down 40% from its 2001 peak near $120.
Use this post and these charts as a reference for the 1999 - 2009 period when looking at how major markets have performed over the last decade.


0 comments:
Post a Comment