
June’s monthly candle closed with a ‘doji’ at Fibonacci resistance - that’s a bearish development as we start the new month of July. Let’s take a look at the S&P 500 monthly chart to see its current structure.
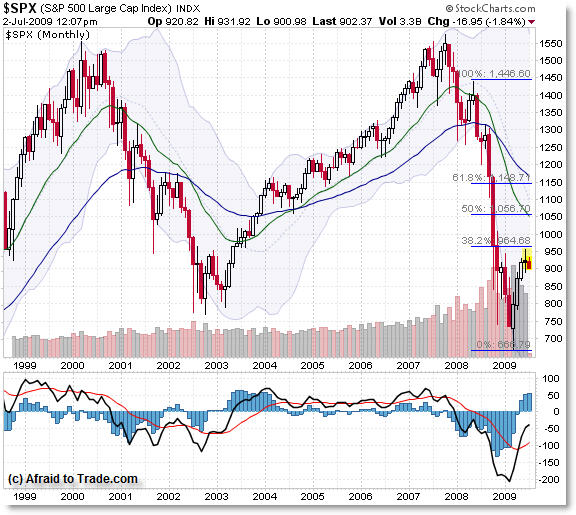
We see the S&P 500 is still below levels from 1998 - in fact, price recently came into the 950 level which was prior support in late 1998 (and for the September spike-down in 2001).
Most importantly, we have come into the 38.2% Fibonacci resistance level of the May 2008 highs to the March 2009 lows - virtually to the point.
In combination with that, we have a bearish doji candle formation at overhead resistance - and as of June 2nd, we have a down-candle.
Don’t put so much emphasis on the two trading days in July as equal to the full months the other candles represent - but it’s telling.
If price continues in the direction it appears to be traveling (down), then we will have a confirmed reversal/retracement down off the 950 highs in mid-June.
The above chart shows a simplified version of the current S&P 500 structure.
For those interested, we are now offering a new weekly report entitled “Weekly Inter-market Technical Analysis” which analyzes each of the Ten-Year Note, S&P 500, Gold, Crude Oil, and the US Dollar Index on a monthly timeframe perspective, beginning with an analysis of the Monthly frame then moving down to the Weekly and Daily frames, noting key areas to watch and possible opportunities ahead.


0 comments:
Post a Comment